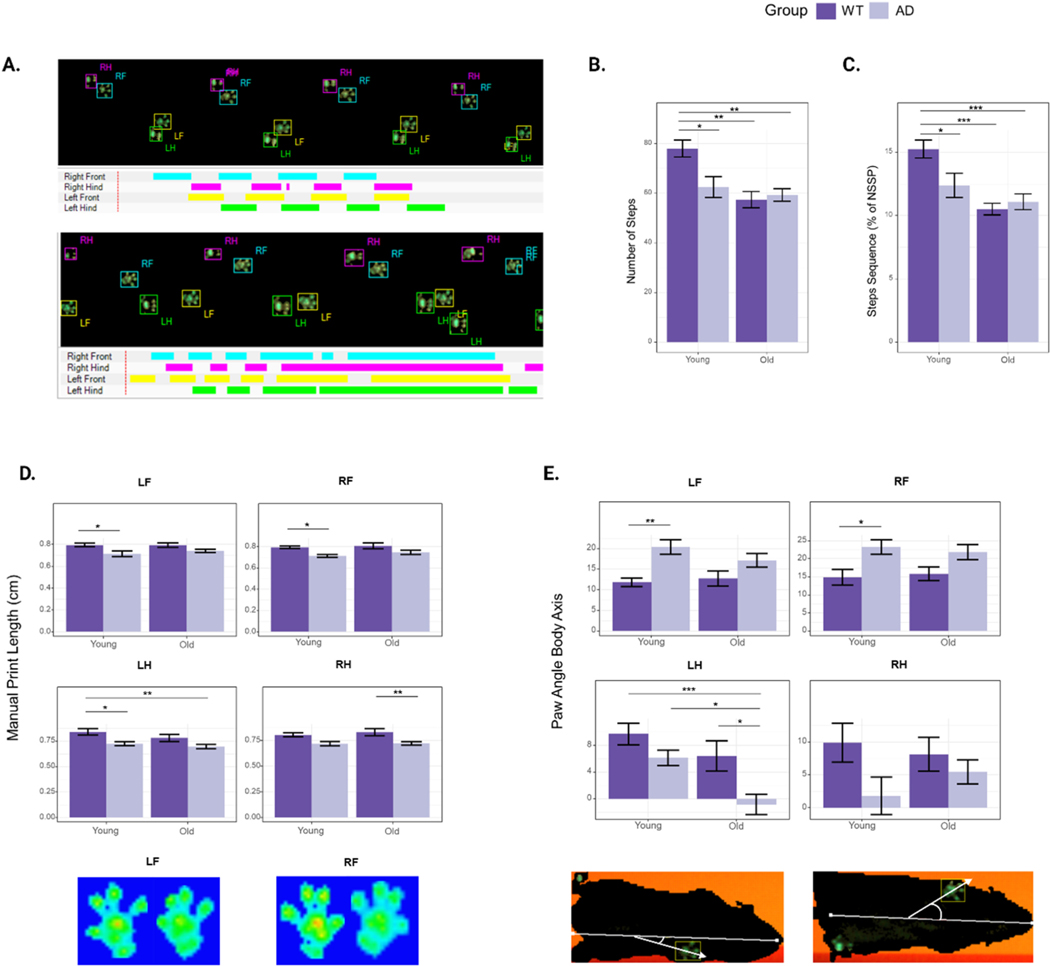
Fig. 1.
Gait analysis of 3xTg-AD and WT mice. A) Example of WT (top) and 3xTg-AD (bottom) paw prints automatically recorded and categorized with the CatWalk XT system. B) Number of classified steps. C) Percentage of time spent in a normal step sequence pattern (NSSP). D) Manual print length, E) intermediate toe spread, F) mean intensity, and G) paw angle body axis for all four paws. The results are expressed as mean ± SEM. Statistics: two-way ANOVA followed by post hoc Tukey HSD test, * p < 0.05, ** p < 0.01, *** p < 0.001. N = 8 WT mice, N = 9 3xTg-AD mice.

