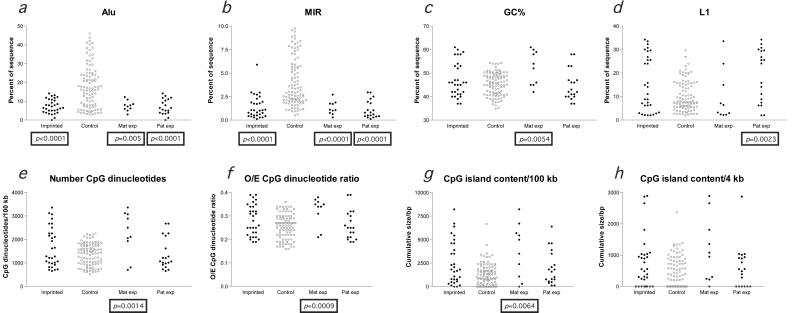
Figure 2.
Significant differences in sequence characteristics exist between imprinted and control loci. Individual measurements at imprinted (filled black circle) and control (open gray circle) loci for each of the parameters indicated are plotted so that the relative distributions are visually apparent. Maternally expressed and paternally expressed subgroups were separately compared with the control sample and are shown on the right of each graph. Mann–Whitney two-tailed tests that revealed differences in the distributions of measurements of imprinted loci compared with controls (remaining significant after a Bonferroni correction) are indicated by the boxed P value below that group. The major genomic characteristic of imprinted regions is the low density of Alu and MIR SINEs (a and b). The one outlying value in b, reflecting a MIR concentration of 5.90% in the 100 kb flanking its promoter, is the WT1 gene, which is paternally expressed in some tissues and maternally expressed in others (34, 35) and consequently is not included in the subgroup analyses. The maternally expressed subgroup has a significantly higher GC (c) and CpG content (e–g) than the control sample, whereas the paternally expressed subgroup has a higher L1 content, indicating that these subgroups of imprinted genes tend to segregate to the different genomic compartments illustrated in Fig. 1. No difference in the size of CpG islands in the 4 kb flanking the transcription start site at imprinted and nonimprinted loci was apparent (h).

