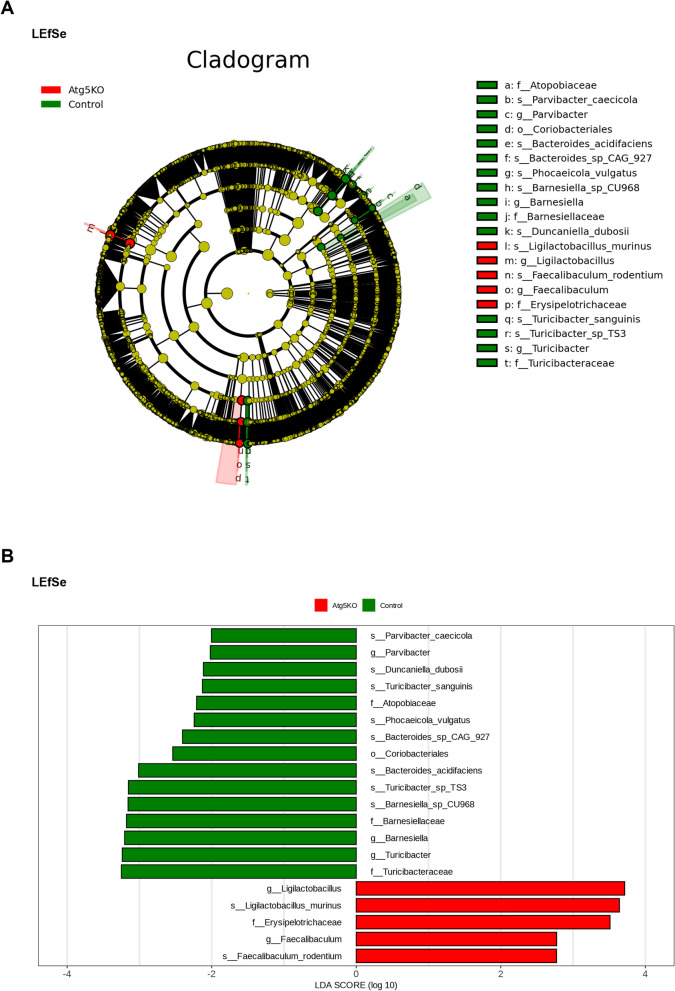
Fig. 4.
Linear discriminant analysis Effect Size (LEfSe) analysis of fecal metagenomics in the control (Atg5+/+) and Atg5−/− basophil transplanted MRL/lpr mice. (A, B) Cladograms and bar plots generated via LEfSe identify significantly different microbiota taxa between groups (Linear discriminant analysis > 2.5, P < 0.05). The diameter of each node in the cladograms is proportional to the relative abundance of the taxonomic unit. Red indicates taxa enriched in the Atg5−/− group and green indicates taxa enriched in the control group

