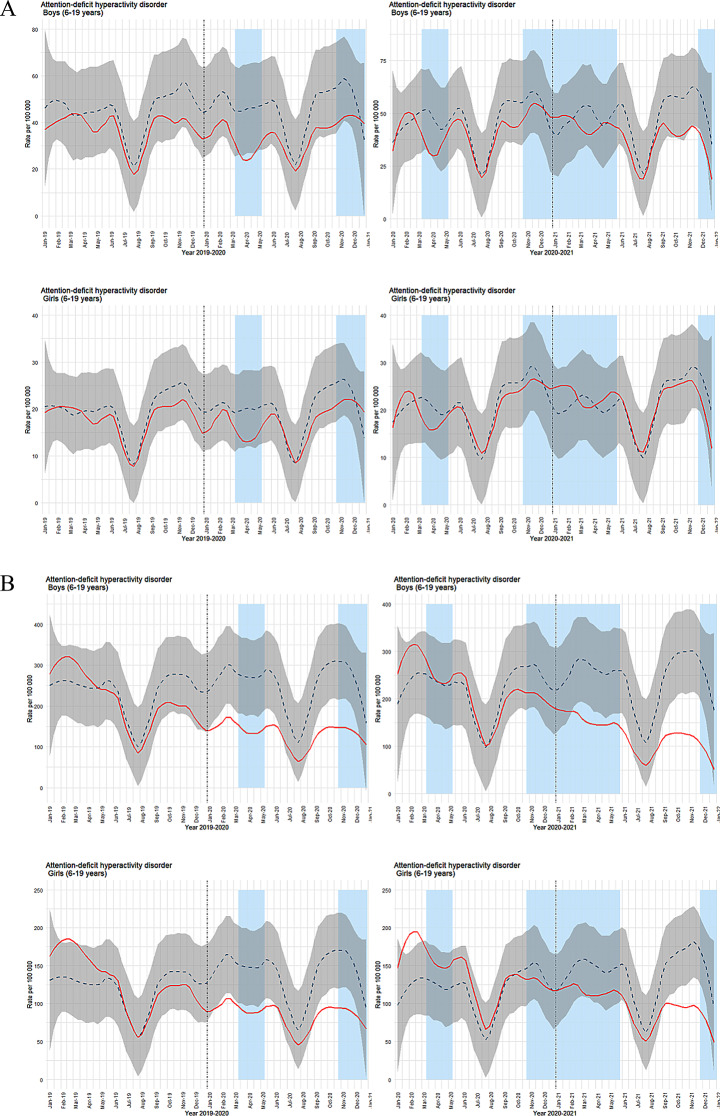
Fig. 4.
(a) Time series plots for weekly consultations for ADHD in primary healthcare (ICPC-2 code: P81). (b) Time series plots for weekly consultations for ADHD in specialist healthcare (ICD code: F90). For both figures, observed consultations per 100,000 are shown as a solid red line, with predicted consultations represented by a dashed blue line and 99.9% confidence interval in grey shading. Light blue columns indicate periods of strict social distancing measures implemented by the Norwegian government. The left column displays results for inclusion year 2018 with follow-up years 2019–2020, while the right column shows inclusion year 2019 with follow-up years 2020–2021. Results for boys are in the top row, and for girls in the bottom row

