
Figure 4.
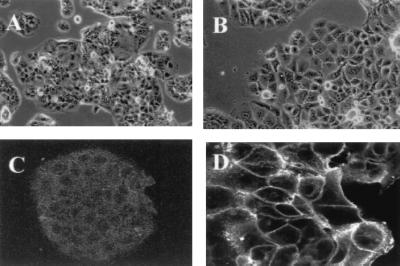
Morphology of the mock transfectant and L3 cDNA-transfected cell lines. Phase-contrast micrograph of mock transfectant AV1 (A) and L3 cDNA transfectant AL3–7 (B). Immunostaining with NCC-3G10 in mock transfectant AV1 (C) and L3 cDNA transfectant AL3–7 (D). (Magnifications: A and B, ×70; C, ×90; D, ×120.)