
Figure 5.
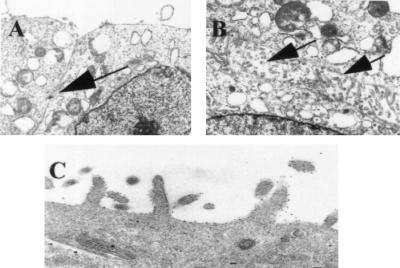
Electron micrograph of L3 cDNA transfectant. Tight cell–cell contact in mock transfectant, AV1 with intercellular junction (arrow) (A). L3 cDNA transfectant AL3–7 with abundant microvilli (arrows) on the cell surface membrane (B). Immunoelectronmicroscopy of the L3 cDNA transfectant AL3–1 indicates localization of dysadherin on the cell membrane (C). (Magnifications: A and B, ×2,000; C, ×10,000.)