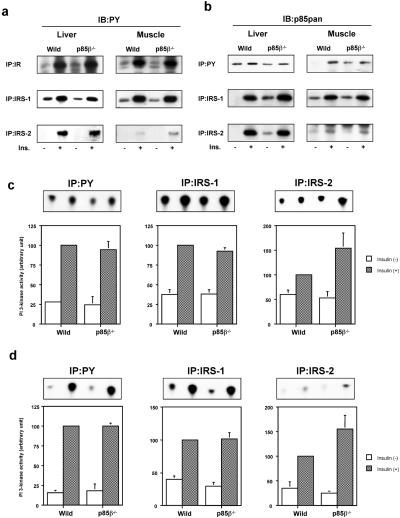
Figure 3.
Effects of disruption of the Pik3r2 gene on insulin-induced tyrosine phosphorylation and PI3K activation. (a) Insulin-induced tyrosine phosphorylation of IR and its substrates. Mice were starved and injected with insulin intravenously. The livers were removed 5 min after and muscles were removed 7.5 min after injection. The lysates from liver (Left) or muscle (Right) were subjected to immunoprecipitation with anti-IR (Top), anti-IRS-1 (Middle), or anti-IRS-2 (Bottom) antibody followed by immunoblotting with 4G10 (PY). (b) Insulin-induced interaction between tyrosine-phosphorylated proteins and the regulatory subunits. The lysates from liver (Left) or muscle (Right) were subjected to immunoprecipitation with 4G10 (Top), anti-IRS-1 (Middle), or anti-IRS-2 (Bottom) antibody followed by immunoblotting with anti-p85pan antibody. (c) PI3K activities associated with tyrosine-phosphorylated proteins in liver. (d) PI3K activities associated with tyrosine-phosphorylated proteins in muscle. The lysates were subjected to immunoprecipitation with 4G10 (Left), anti-IRS-1 (Center), or anti-IRS-2 (Right) followed by PI3K assay. Panels (Upper) show representative results; in graphs (Lower), each bar represents the mean ± SEM of the relative PI3K activity calculated from the results of three independent experiments.

