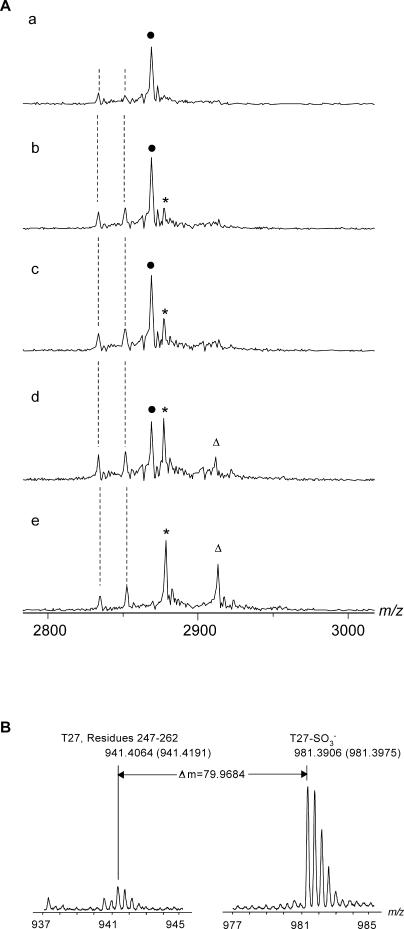
Figure 7. M. tuberculosis APS Forms a Thiosulfonate-Enzyme Intermediate in the Absence Thioredoxin.
(A) ESI mass spectra in low resolution showing the titration of APS reductase with APS in 50 mM NH4OAc (pH 7.5). In tracings labeled a to e, the concentration of APS was 0, 1, 2, 4, and 10 μM, respectively. The concentration of APS reductase is 15 μM in all cases. Peaks indicate ions corresponding to the 10+ charge states of the enzyme (E, solid circles), the covalent intermediate (E-SO3 −, asterisks), and the noncovalent complex between the intermediate and AMP (E-SO3 − • AMP, triangles). The dashed lines highlight the ions of APS reductase that lack a mature iron-sulfur cofactor. The concentrations of APS reductase reported in this figure were measured prior to mass analysis. A small fraction of protein loss occurs during the mass analysis, and thus the reported concentrations of protein should be treated as an upper limit.
(B) ESI mass spectra of trypsin-digested APS reductase incubated with a 10-M excess of APS. The C-terminal peptide (T27, residues 247–262) containing Cys249 showed a +80 Da shift (right tracing) corresponding to the molecular weight of a sulfite compared to the unmodified peptide (left tracing). The measured m/z values of the peptide with and without bound sulfite are indicated in the spectra. Shown in parenthesis are the theoretical values.

