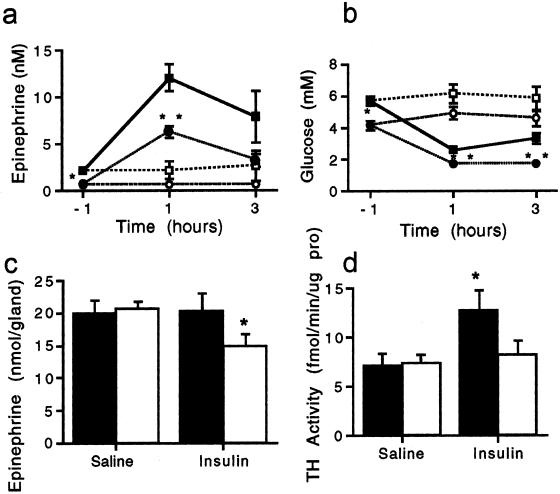
Figure 7.
Plasma epinephrine and glucose after insulin shock in PACAP-deficient vs. wild-type mice. (a) Plasma epinephrine levels after insulin: ■, +/+ 2 units of insulin per kg; ●, −/− 2 units of insulin per kg; □, +/+ saline; and ○, −/− saline. *, P < 0.05; **, P < 0.001 relative to +/+ by one-way ANOVA with Scheffé's post-hoc test. (b) Blood glucose levels after insulin: ■, +/+ 2 units of insulin per kg; ●, −/− 2 units of insulin per kg; □, +/+ saline; and ○, −/− saline. *, P < 0.05; **, P < 0.001 relative to +/+ by one-way ANOVA with Scheffé's post-hoc test. (c) Adrenal epinephrine levels 4 h after 2 units of insulin per kg or saline: filled bars, +/+; and open bars, −/−. *, P < 0.05 relative to +/+ by one-way ANOVA with Scheffé's post-hoc test. (d) TH is not induced in PACAP knock-out adrenal medulla 4 h after 2 units of insulin per kg: filled bars, +/+; and open bars, −/−. *, P < 0.05 relative to +/+ saline by one-way ANOVA with Scheffé's post-hoc test.

