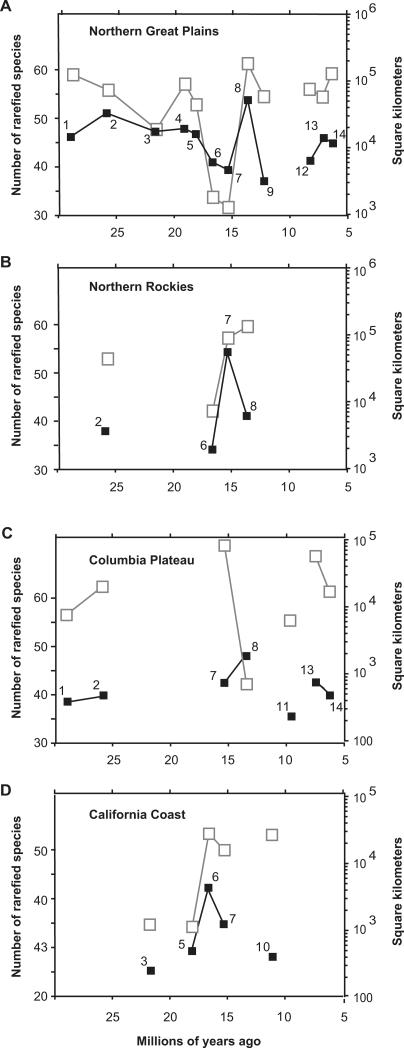
Figure 4. Comparison of Species Diversity and Geographic Sampling Area through Time.
Black lines and black boxes are time-series plots of occurrence-rarefaction species richness at 75 occurrences for each of the four biogeographic provinces. The numbers by the data points identify the time bins as indicated in Table 1; bin 1 is oldest and bin 14 is youngest. Gray lines and open boxes show the geographic area sampled for each time bin.
(A) Northern Great Plains (region 3 in Figure 1).
(B) Northern Rockies (region 2).
(C) Columbia Plateau (region 1).
(D) Coastal California (region 6).

