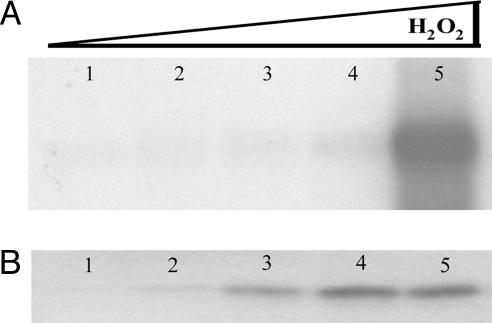
Fig. 1.
SsDps expression in response to oxidative stress. (A) Northern blot analysis of RNA extracted from exponential growth phase (OD650 ≈0.5) S. solfataricus cells. Lane 1, standard growth conditions (0 μM H2O2); lane 2, 5 μM H2O2; lane 3, 10 μM H2O2; lane 4, 20 μM H2O2; lane 5, 30 μM H2O2. Approximately 1.5 μg of total RNA was loaded in each lane. (B) Western blot analysis of total protein extract from logarithmic (OD650 ≈0.5) S. solfataricus cells. Loads are normalized according to number of cells, and lane assignments are as above. Densitometry and loading controls are available in Fig. 8.

