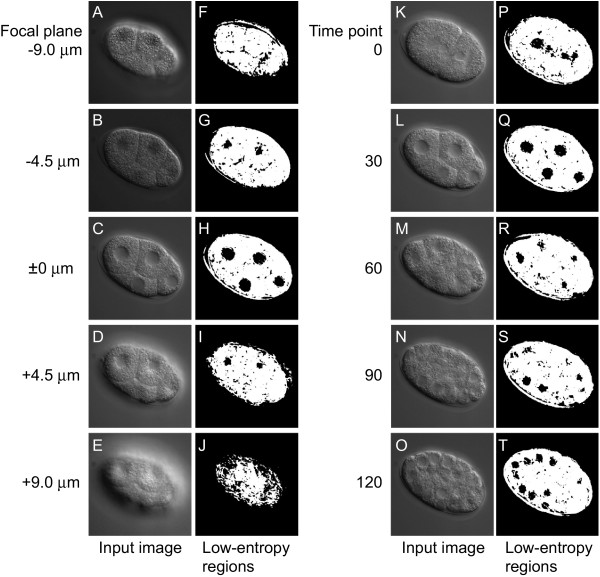
Figure 3.

Low-entropy regions of different focal planes and different time points. (A – E and K–O) Input images. (F–J and P–T) Low-entropy regions (black) produced from the input images. Low-entropy regions were produced from multifocal images of an embryo at a specific time point in the four-cell stage with 4.5 μm between two focal planes (A–E) and from time-lapse images of an embryo at a specific focal plane with 30 min between two time points (K–L). The low-entropy regions produced are displayed to the right of each input image. The window size was 10 × 10 pixels and the threshold value was 175.
