
Figure 1.
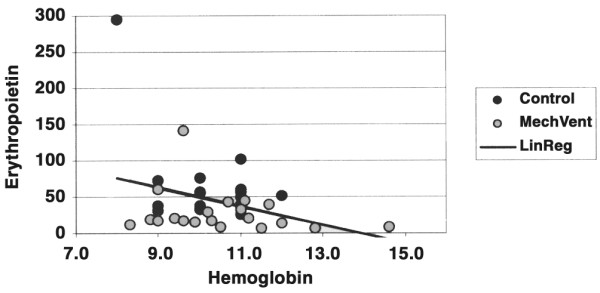
Linear regression: erythropoietin as a function of hemoglobin. The line represents the best fit to the values in the control group.
Official websites use .gov
A
.gov website belongs to an official
government organization in the United States.
Secure .gov websites use HTTPS
A lock (
) or https:// means you've safely
connected to the .gov website. Share sensitive
information only on official, secure websites.
Linear regression: erythropoietin as a function of hemoglobin. The line represents the best fit to the values in the control group.