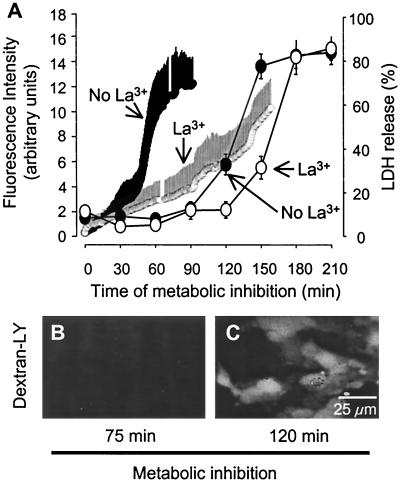
Figure 3.
EtdBr uptake induced by metabolic inhibition precedes membrane breakdown. (A) Time course of EtdBr uptake by confluent astrocytes during metabolic inhibition averaged for 10 cells ± SD (fluorescence intensity, left ordinate) and LDH release to the extracellular medium (right ordinate). LDH release from cultures was measured in 96-well plates by using a kit from Promega and expressed as the percentage of total LDH in sister cultures. EtdBr uptake accelerated after about 45 min metabolic inhibition and reached a plateau at about 90 min (small filled circles, frequent measurements, mean ± SD for 10 cells, representative of three experiments). In astrocytes with the same treatment but in the presence of La3+ (small open circles), EtdBr uptake increased slowly until about 140 min and then accelerated. LDH release above baseline (see Materials and Methods) was detected after 120 min metabolic inhibition and was near maximal after 150 min (large filled circles). In the presence of La3+, LDH release was delayed by about 30 min (large open circles). Each data point represents the average ±SD of six wells in each of three experiments. (B) Astrocytes subjected to 75 min metabolic inhibition were impermeable to dextran-LY (10 kDa), although they were permeable to EtdBr (not shown). (C) After 120 min metabolic inhibition, astrocytes were permeable to dextran-LY.

