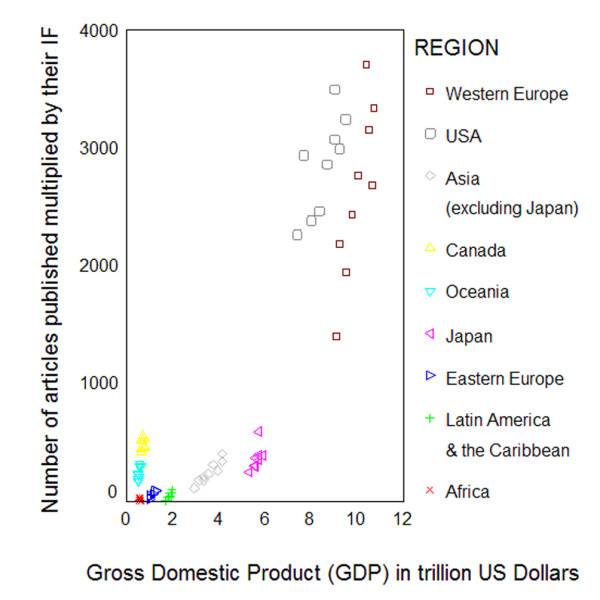
Figure 1.

'Total product' of research productivity. Scatter plot depicting the relationship of the annual total product of research productivity (number of articles published × their impact factor [IF]) in critical care medicine, for different world regions, for the period 1995–2003, with the gross domestic product (GDP) in trillions of 1995 US dollars.
