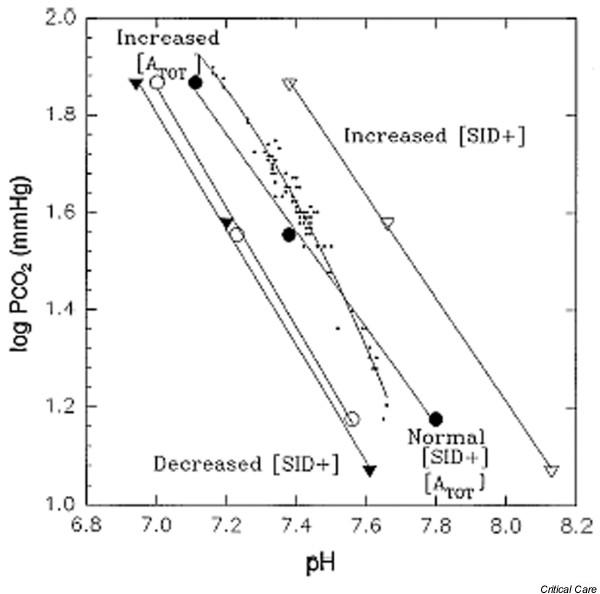
Figure 1.

The buffer curve. The line plots of linear in vitro (○, △, ●, ▲) and curvilinear in vivo (dots) log PCO2 versus pH relationship for plasma. ○, plasma with a protein concentration of 13 g/dl (high [ATOT]); △, plasma with a high [SID+] of 50 mEq/l; ●, plasma with a normal [ATOT] and [SID+]; ▲, plasma with a low [SID+] of 25 mEq/l; dots, curvilinear in vivo log PCO2 versus pH relationship. [ATOT], total concentration of weak acids; PCO2, partial CO2 tension; SID+, strong ion difference. Reproduced with permission from Constable [4].
