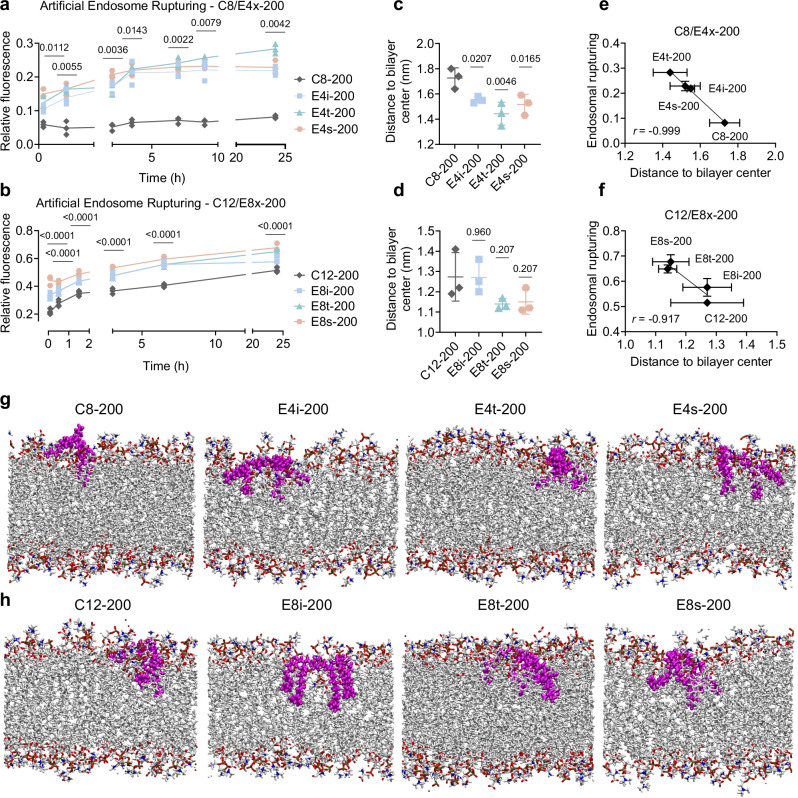
Fig. 5. BEND ILs enhance LNP delivery via increased endosomal disruption.
a, b Artificial endosomes were constructed via thin film hydration of DOPE, DOPC, DOPS, NBD-PE, and Liss-Rhod-PE at a molar ratio of 48:25:25:1:1, respectively. Endosomes were mixed with a C8-200, E4i-200, E4t-200, and E4s-200 (C8/E4x 200-core) LNPs or b C12-200, E8i-200, E8t-200, and E8s-200 (C12/E8x 200-core) LNPs, and fluorescence was measured at 465/520 nm at several timepoints over 24 h. Relative fluorescence is reported as mean ± SD of n = 3 technical replicates. Atomistic MD simulations were performed by modeling the insertion of a single IL into a lipid bilayer membrane with a mixture of DOPE, DOPC, and DOPS at a molar ratio of 2:1:1, respectively for c C8/E4x 200-core ILs and d C12/E8x 200-core ILs. The vertical distance of the center of mass of the IL to the bilayer center is reported as mean ± SD of n = 3 technical replicates. Correlation between artificial endosomal rupturing and bilayer penetration experiments for e C8/E4x 200-core LNPs/ILs and f C12/E8x 200-core LNPs/ILs. Data is represented as mean ± SD of bilayer penetration (horizontal) and endosomal disruption (vertical) of n = 3 technical replicates. Snapshots during the simulations of g C8/E4x 200-core ILs and h C12/E8x 200-core ILs. The IL is colored magenta and the nitrogen, oxygen, carbon, and hydrogen atoms in the lipid bilayer are colored blue, red, white, and white, respectively. Two-way ANOVA with Holm–Šídák correction for multiple comparisons were used to compare relative fluorescence across timepoints and LNPs to a C8-200 and b C12-200. The least significant adjusted p value out of the three branching groups is shown above each timepoint. One-way ANOVA with Holm–Šídák correction for multiple comparisons were used to compare distance to bilayer center across treatment groups to c C8-200 and d C12-200. Source data are provided as a Source Data file.

