
Figure 2.
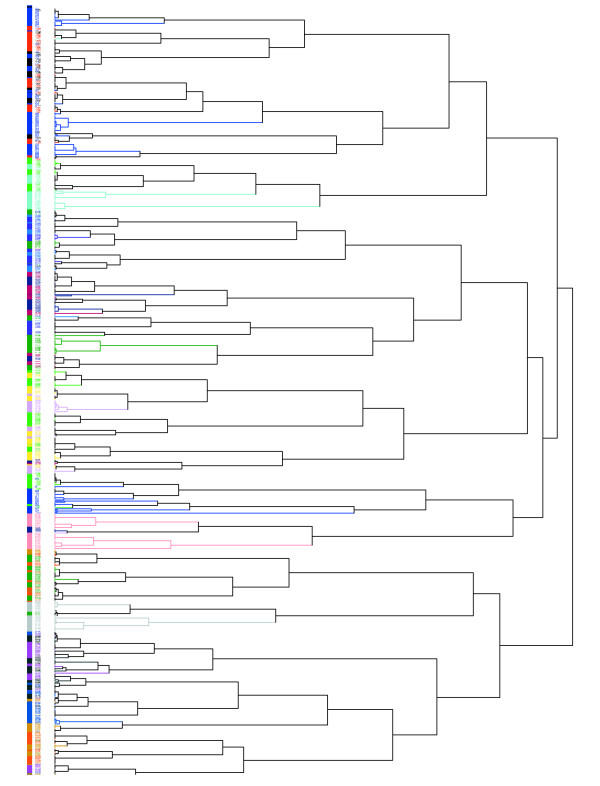
Hierarchical cluster plot of simulation with ten genotypes, 100 noise genes, and 20 factors. ρ = 0.4, effect size = 1, 2,...20. Blue, noise genes; other colors represent genes that should cluster together.
Official websites use .gov
A
.gov website belongs to an official
government organization in the United States.
Secure .gov websites use HTTPS
A lock (
) or https:// means you've safely
connected to the .gov website. Share sensitive
information only on official, secure websites.
Hierarchical cluster plot of simulation with ten genotypes, 100 noise genes, and 20 factors. ρ = 0.4, effect size = 1, 2,...20. Blue, noise genes; other colors represent genes that should cluster together.