
Figure 3.
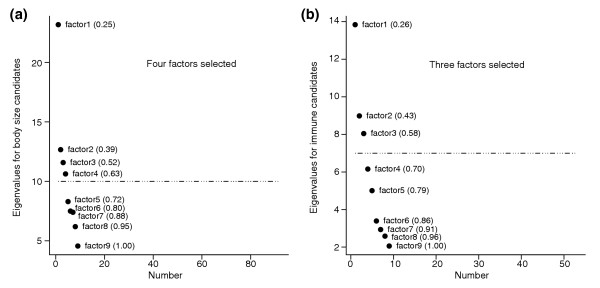
SCREE plots. The x-axis is the ordinal number of the eigenvalue and the y-axis is the magnitude of the eigenvalue. The number to the right of the plotted point indicates the cumulative variance explained as each factor is added. The dotted line indicates the cutoff point in the SCREE plot where there is a sharp drop off in the magnitude of the eigenvalues. The number of factors above the dotted line are the number retained for the factor analysis. (a) Body size, 92 genes; four factors are selected. (b) Immune, 53 genes; three factors are selected [36].