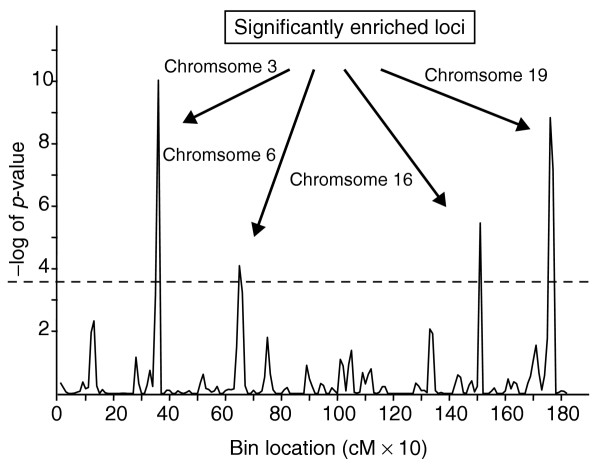
Figure 3.

Identification of genomic regions controlling obesity-associated pathway gene expression. The x-axis represents sequential 10-cM intervals across the genome and the y-axis represents the negative log10 of adjusted Fisher's exact test p-value for enrichment of eQTLs in overlapping 20-cM bins. The dashed line corresponds to the p-value 0.05 after correcting for multiple comparison. The four significantly enriched regions on chromosomes 3, 6, 16, and 19 are indicated by arrows.
