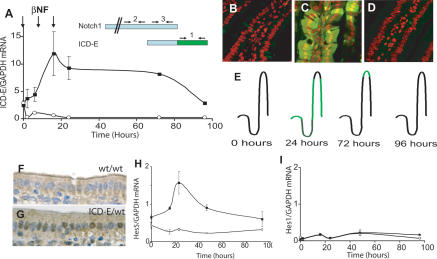
Figure 2.
Inducible expression of ICD-E in adult mouse intestinal epithelium. (A) Ahcre/R26ICDEfl/wt mice and Ahcre/R26wt/wt control mice were injected with βNF (arrows) and sacrificed at the time points shown. Real-time RT–PCR was used to detect ICD-E mRNA in intestinal mRNA. (Solid squares) Ahcre/R26ICD-E/wt mice; (open circles) Ahcre/R26wt/wt controls. Error bars indicate standard error of the mean in two experiments performed in triplicate. (Inset) Location of PCR primers used to amplify ICD-E alone (1), endogenous Notch alone (2), or both RNAs (3). (B–E) Confocal microscopy of the jejunal villi of Ahcre/R26ICD-E/wt mice for ICD-E (green); nuclei were stained with Topro III (red). (B) Uninduced. (C) Twenty-four hour. (D) Seventy-two hour. (E) Summary of location of recombinant epithelium (green) following recombination. (F,G) Immunohistochemical staining for Notch1 ICD at 24 h post-induction. (F) Ahcre/R26wt/wt. (G) Ahcre/R26ICD-E/wt. (H,I) Quantitative PCR analysis of Hes5 (H) and Hes1 (I) mRNA normalized to GAPDH. (Solid squares) Ahcre/R26ICD-E/wt mice; (open circles) Ahcre/R26wt/wt controls. Error bars indicate standard error of the mean in two experiments performed in triplicate.

