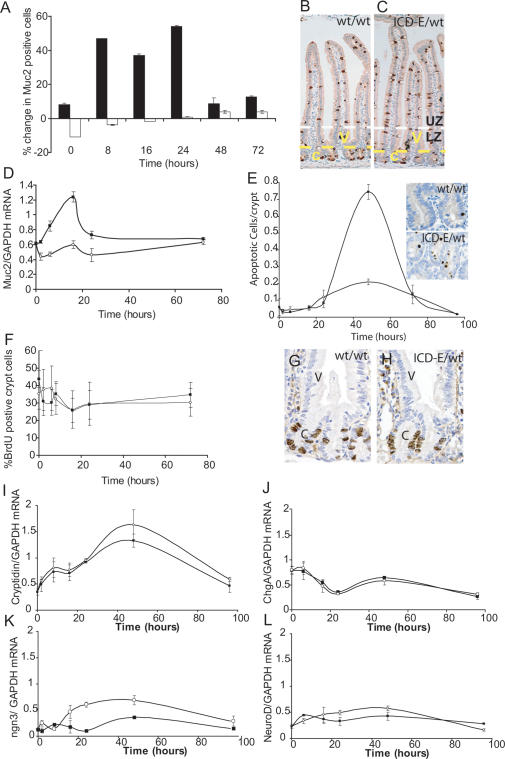
Figure 3.
Phenotype of recombinant epithelium. (A) Immunohistochemical analysis of goblet cell numbers. Values shown are the number of Muc2-positive cells in the crypt (open bars) and the villi (solid bars) in Ahcre/R26ICD-E/wt mice, expressed as a percentage of the corresponding value in Ahcre/R26wt/wt control animals at the same time point. Cell counts of at least 500 cells (crypts) and 3000 cells (villi) were performed on duplicate mice at each time point. (B,C) Appearance of intestine stained for Muc2 (brown) 24 h post-induction. (B) Ahcre/R26wt/wt; (C) Ahcre/R26ICD-E/wt. (c) Crypts; (V) villi. The yellow dotted line is the crypt/villus boundary, and the white dotted line indicates the boundary between the labeled zone (LZ) and unlabeled zone (UZ) (see text and cf. Fig, 4C). (D) Quantitative RT–PCR for Muc2 mRNA following induction. (Solid squares) Ahcre/R26ICD-E/wt mice; (open circles) Ahcre/R26wt/wt controls. (E) Number of Caspase-3-positive apoptotic cells per crypt following recombination. (Solid squares) Ahcre/R26ICD-E/wt mice; (open circles) Ahcre/R26wt/wt controls. Insets show typical crypts in induced Ahcre/R26wt/wt and Ahcre/R26ICD-E/wt animals at 48 h. (F) Percentage of S-phase cells in intestinal crypts following induction assessed by 1 h of pulse BrdU labeling. (Solid squares) Ahcre/R26ICD-E/wt mice; (open circles) Ahcre/R26wt/wt controls. (G,H) Location of S-phase cells 24 h post-induction. (c) Crypts; (V) villi. (I–L) Quantitative RT–PCR for Cryptidin (I), Chromogranin A (J), ngn3 (K), and NeuroD (L).

