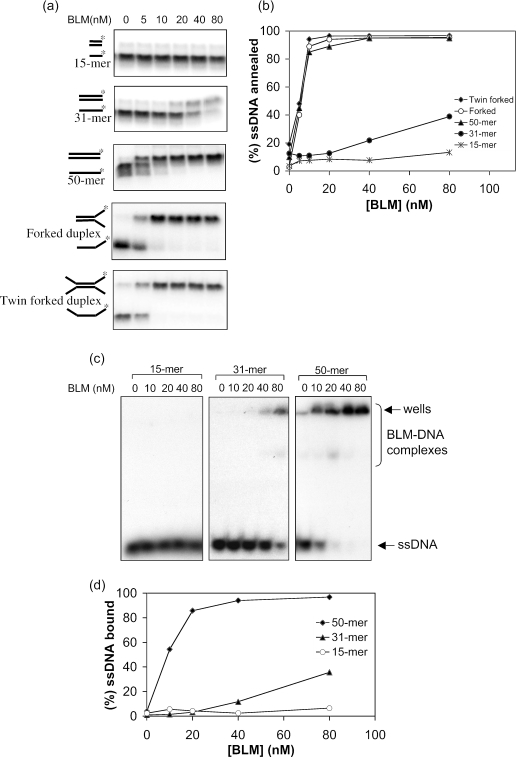
Figure 4.
Strand annealing of different ssDNA structures by BLM. (a) In each case, different concentrations of BLM (indicated above the lanes) were incubated with the ssDNA species indicated on the left of each autoradiogram. The positions of the unannealed ssDNA and the annealed fully duplex or partial duplex products are indicated on the left. (b) Quantification of the data in (a). (c) Gel retardation assays with increasing quantities of BLM and the ssDNA oligonucleotides indicated above the wells. The positions of the ssDNA and the retarded BLM–DNA complexes are shown on the right. (d) Quantification of the data from (c).

