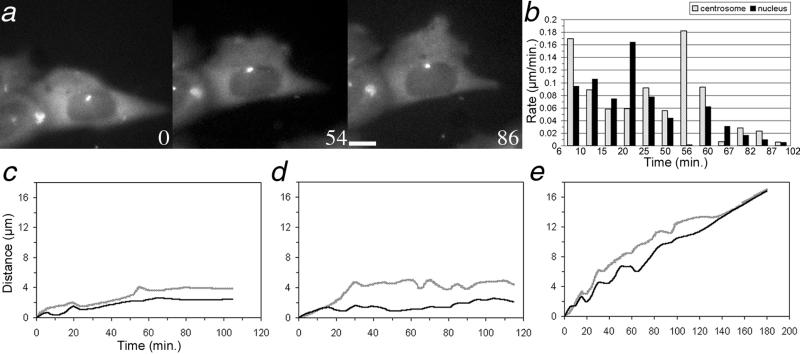
Figure 1.
(a) Time-lapse sequence of a living wound-edge CHO cell expressing GFP-γ–tubulin; time, in minutes, is given in the lower corner of each panel. Bar, 5 μm. The direction of cell motility is toward the top of the page. Note the movement of the centrosome to the front of the nucleus between panels 0 and 54 and its subsequent persistence in that position. Cells behind the wound-edge cell were not expressing GFP–γ-tubulin and thus are not visible in the fluorescence image. (b) Histogram of rates of movement of the centrosome and nucleus for the cell shown in a; the end of the time interval used to measure the rate is shown on the x axis. (c–e) Plots of the distance the centrosome and nucleus moved from their initial positions over time. (b) Graph corresponds to the cell shown in a. In each example, the centrosome moves forward a greater distance than the nucleus such that it reorients and remains in front of the nucleus.

