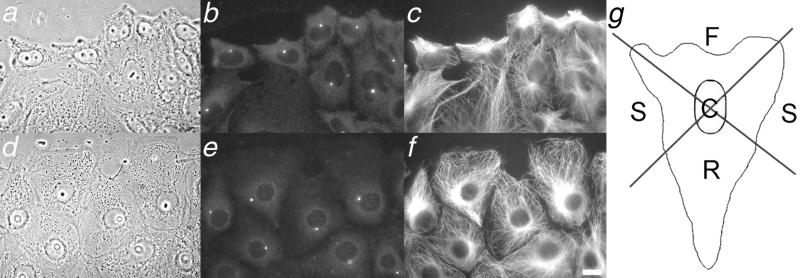
Figure 3.
Centrosome behavior in wound-edge CHO and PtK cells. Phase images (a and d) are shown, along with corresponding immunolocalization of γ-tubulin (b and e) and microtubules (c and f). Bar, 5 mm. Note the greater proportion of centrosomes oriented toward the wound edge in CHO cells than in PtK cells. (g) Diagram of cellular regions used to score centrosome position. Front, sides, rear and center regions are labeled F, S, R, and C, respectively. The wounds are toward the top of the figure; images were acquired ∼ 2.5 h after wounding.

