Figure 1.
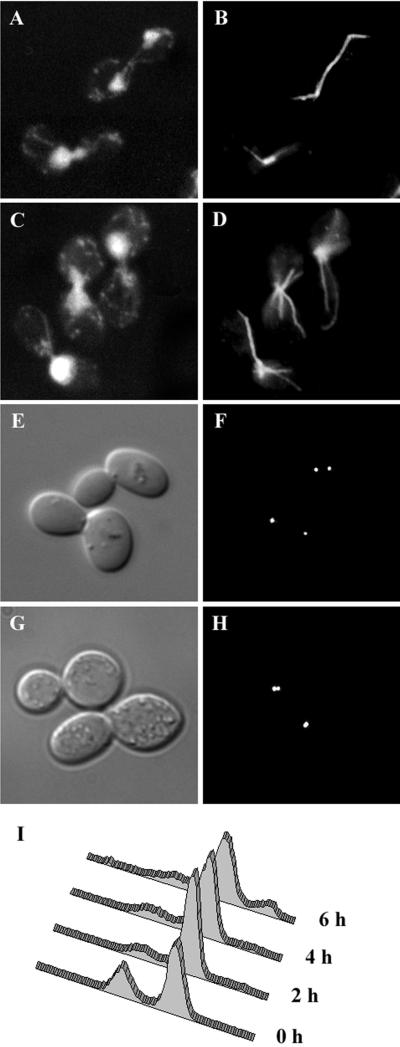
Phenotype of stu1–5 cells. (A–D) stu1–5 strain (CUY1000) was grown at 22°C (A and B) and shifted to 37°C for 3 h (C and D). Cellular DNA was visualized by DAPI staining (A and C) and microtubules by immunofluorescence (B and D). (E–H) stu1–5 stain expressing Spc42-GFP (CUY1158) was grown at 22°C (E and F) and shifted to 37°C for 3 h (G and H). (E and G) DIC. (F and H) Spc42-GFP. (I) DNA content of stu1–5 cells (CUY1000) grown at 22°C (0 h) and after a shift to 37°C for 2, 4, and 6 h. The DNA content of individual cells was determined by flow cytometry (Haase and Lew, 1997).

