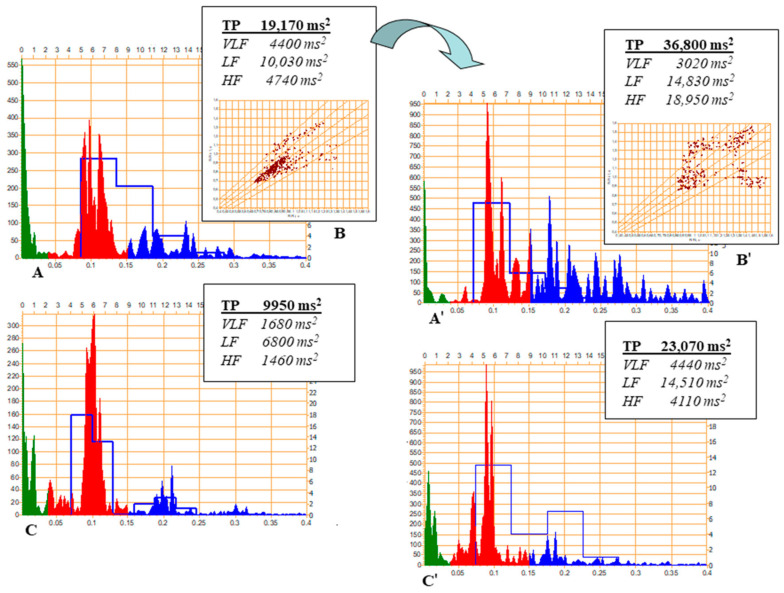
Figure 1.
An example of heart rate variability (HRV) monitoring in an elite athlete before and after the two-week supplementation with oil derived from the seeds of Amaranthus cruentus. The presentation of the spectrogram (A) and scatter plot (B) in a supine position, and the spectrogram in an orthostatic position (C) before and after (correspondingly (A’–C’) supplementation. A significant increase in TP due to activation of the autonomic nervous system (LF and, especially, HF) is associated with the reduction (optimization) of central regulatory influences (decrease in VLF) in a supine position. Note also an “expansion of regulatory area” located around 0.15–0.2 Hz at the scatter plot A’, which may be seen as a sign of developing a hormetic response that is also linked to mechanisms of anti-aging (adapted from [80]). Note: HF—high frequency (blue color on the spectrogram); LF—low frequency (red color on the spectrogram); TP—total power; VLF—very low frequency (green color on the spectrogram). Spectrogram on the x-axis: top—breathing rate, 1/min; bottom—frequency, Hz; on the y-axis: left—amplitude, ms2/Hz × 1000; right—number of breathing cycles.

