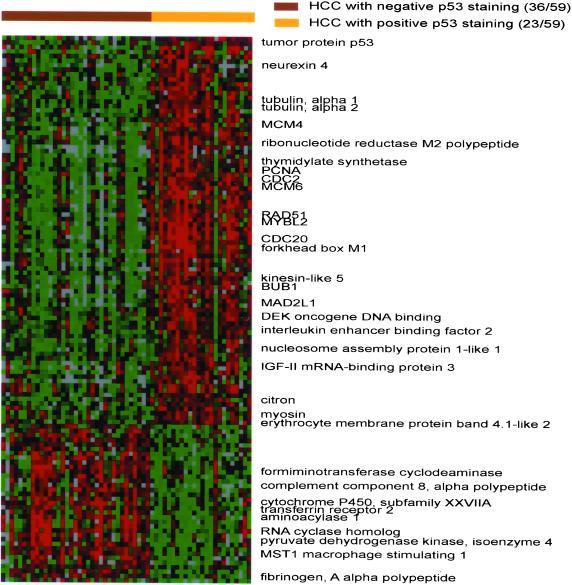
Figure 4.
Hierarchical clustering of 121 genes whose expression level was significantly correlated with the presence or absence of nuclear p53 immunostaining in HCC (permutation p value < 0.001; corresponding to a PFER of 4.043 and a nominal FDR of ∼0.035). The scale is the same as Figure 1. The colored bars above the panel indicate p53 positive (yellow) or negative tumor samples (brown). Due to space limitation, only some of the genes are labeled. The complete data with clone ID and gene names are available at the supplementary information.

