Abstract
The objective of this study was to determine if experimental gastric dilatation volvulus (GDV) would decrease adenosine triphosphate (ATP) concentration and increase membrane conductance of the canine gastric and jejunal mucosa. Male dogs (n = 15) weighing between 20 and 30 kg were used. Dogs were randomly assigned to 1 of 3 equal groups: Group 1 was control, group 2 was GDV, and group 3 was ischemia. All dogs were anesthetized for 210 min. Group 1 had no manipulation. Group 2 had GDV experimentally induced for 120 min followed by decompression, derotation, and reperfusion for 90 min. Group 3 had GDV experimentally induced for 210 min. Gastric (fundus and pylorus) and jejunal tissue was taken at 0, 120, and 210 min from all of the dogs. Tissue was analyzed for ATP concentration, mucosal conductance, and microscopic changes. The ATP concentration in the fundus did not change significantly from baseline in group 2, but decreased significantly below baseline at 210 min in group 3. The ATP concentration in the jejunum decreased significantly below baseline in groups 2 and 3 at 120 min, remaining significantly decreased in group 3 but returning to baseline at 210 min in group 2. Mucosal conductance of the fundus did not change significantly in any dog. Mucosal conductance of the jejunum increased at 120 min in groups 2 and 3, and became significantly increased above baseline at 210 min. The jejunal mucosa showed more profound cellular changes than the gastric mucosa. The jejunum showed substantial decreases in ATP concentration with an increase in mucosal conductance, suggesting cell membrane dysfunction. Dogs sustaining a GDV are likely to have a change in the activity of mucosal cells in the jejunum, which may be important in the pathophysiology of GDV.
Résumé
L’objectif de cette étude était de déterminer si une dilatation gastrique par volvulus (GDV) induite expérimentalement diminuerait la concentration d’adénosine triphosphate (ATP) et augmenterait la conductance de membrane des muqueuses gastrique et jujénale du chien. Des chiens mâles (n = 15) pesant de 20 à 30 kg ont été utilisés. Les chiens ont été répartis également au hasard à 1 des 3 groupes suivants : groupe 1, témoin; groupe 2, GDV; et groupe 3, ischémie. Tous les chiens ont été anesthésiés pour 210 min. Le groupe 1 n’a subit aucune manipulation. Le groupe 2 a eu une GDV provoquée expérimentalement pendant 120 min suivi d’une décompression, d’une détorsion et de re-perfusion pour 90 min. Le groupe 3 a également subit une GDV expérimentale pendant 210 min. Des échantillons de tissu provenant de l’estomac (fundus et pylore) et du jéjunum ont été prélevés de tous les chiens après 0, 120 et 210 min. Les tissus ont été analysés pour déterminer la concentration en ATP, la conductance mucosale et les changements microscopiques. La concentration en ATP dans le fundus n’a pas changé significativement de la valeur de base dans le groupe 2, mais a diminué de manière significative sous la valeur de base après 210 min dans le groupe 3. La concentration en ATP dans le jéjunum a diminué sous la valeur de base de manière significative pour les groupes 2 et 3 à 120 min, est demeurée significativement réduite pour le groupe 3 mais est retournée à la valeur de base à 210 min pour le groupe 2. La conductance mucosale du fundus n’a pas changé de manière significative chez aucun chien. La conductance mucosale du jéjunum a augmenté à 120 min pour les groupes 2 et 3, et est devenue significativement supérieure à la valeur de base à 210 min. La muqueuse jéjunale présentait des changements cellulaires plus marqués que la muqueuse gastrique. Une diminution marquée de la concentration en ATP et une augmentation de la conductance mucosale au niveau du jéjunum suggèrent un dysfonctionnement de la membrane cellulaire. Les chiens avec une GDV sont sujets à avoir des changements dans l’activité des cellules mucosales du jéjunum, qui pourraient être importants dans la pathophysiologie des GDV.
(Traduit par Docteur Serge Messier)
Introduction
Gastric dilatation-volvulus (GDV) is a life-threatening condition characterized by accumulation of air in the stomach, gastric mal-position with increased intraluminal pressure, and hemodynamic abnormalities that lead to shock (1,2). Appropriate therapy for GDV consists of gastric decompression, intravenous fluid administration, and surgical intervention to reposition the stomach. Despite therapy, at least 15% to 24% of affected dogs die and the mortality rate may be higher if the dogs have concurrent gastric necrosis (2–5).
Gastric dilatation-volvulus is characterized by ischemia of gastric and intestinal tissue, as well as generalized inadequate tissue perfusion primarily due to the mechanical occlusion of the caudal vena cava and portal vein during dilatation and volvulus (6). Gastric dilatation-volvulus results in both intramural edema and hemorrhage in both the gastric and intestinal mucosal, and serositis of the gastric and intestinal tissue. Necrosis of the muscular tunic in the stomach has been noted, as well as villi epithelial loss in the small intestine (7). Mucosal damage can allow for transmural translocation of bacteria and endotoxins with development of bacteremia and endotoxemia.
Organ ischemia results in an increase in consumption and decrease in production of adenosine triphosphate (ATP) (8). Since ATP is important for cellular functions that maintain membrane structure and transport function, tissue respiration, carbohydrate metabolism, and other intracellular energy-requiring functions, the depletion of gastric and intestinal mucosal ATP during GDV may reflect a decrease in mucosal function (9,10).
This study evaluated the concentration of ATP, adenosine diphosphate (ADP), and adenosine monophosphate (AMP) in the gastric and jejunal mucosa, and changes in the mucosal membrane conductance of dogs undergoing experimentally induced GDV. It was hypothesized that the concentration of ATP would decrease during ischemia and increase during reperfusion, and that changes in ATP concentration in the mucosa would parallel a reciprocal change in mucosal membrane conductance.
The information gained from this study helps to characterize both the functional and microscopic mucosal changes in the stomach and jejunum in dogs undergoing experimental GDV. Clinically, much observation and decision-making is focused on the serosal appearance of the fundus with little understanding of changes at the mucosal level of the fundus and jejunum. In addition, understanding the changes in ATP concentration in the gastrointestinal tissues may ultimately lend itself to therapy with exogenous ATP in an effort to support depleted tissues.
Materials and methods
The study was approved by the Institutional Animal Care and Use Committee of Louisiana State University.
Experimental design
Fifteen mixed breed male dogs weighing between 20 and 30 kg were randomly assigned to 1 of 3 groups: Group 1 — control; group 2 — GDV; and group 3 — ischemia. An anesthetic protocol of acepromazine (0.05 mg/kg) and butorphanol (0.2 mg/kg) as premedication, thiopental sodium (15 mg/kg) as an induction agent and isoflurane and oxygen for anesthesia maintenance was used. A balanced electrolyte solution (10 mL/kg bodyweight [BW]/h) was administered intravenously for the duration of the procedure in all dogs. The rate was increased to 20 mL/kg BW/h when the mean arterial blood pressure fell below 60 mmHg.
Dogs were placed on a heating pad in dorsal recumbency and indwelling catheters were placed in the right femoral artery and left jugular vein for measurement of mean arterial pressure and central venous pressure, respectively, and for the purpose of blood sampling. An indwelling urinary catheter was placed and connected to a closed collection system.
A ventral midline abdominal incision was made. An indwelling catheter was placed in a jejunal vein for measurement of portal pressure. In group 1, anesthesia was maintained for 210 min and samples were taken at designated times. In groups 2 and 3, a 14-F Foley catheter was placed through a pursestring suture in the pyloric antrum to inflate the stomach with room air. An umbilical tape ligature was placed around the distal esophagus and around the proximal duodenum, avoiding the vagus nerve and gastric vessels. The stomach was rotated clockwise by moving the pylorus ventrally and suturing it to the dorsal body wall adjacent to the cranial pole of the left kidney. This resulted in a gastric rotation of approximately 235 degrees. The body and fundus of the stomach were pushed dorsally and to the right to facilitate rotation. The greater omentum that was seen covering the stomach and the duodenum was positioned adjacent to the esophagus. An air compressor was connected to the Foley catheter and the stomach was inflated with air until an intragastric pressure of 30 mmHg was reached, documented by connecting the catheter to a transducer. This connection was maintained throughout the procedure and the intragrastric pressure was constantly monitored in all dogs. Re-inflation was performed when necessary to maintain the pressure at 30 mmHg. After any tissue sampling, intragastric pressure was measured and any inflation that was necessary was performed to attain intragastric pressure of 30 mmHg.
In group 2, the intragastric pressure was maintained for 120 min. At 120 min, the stomach was then decompressed, repositioned, and the umbilical tape ligatures were cut. The dog was then monitored for an additional 90 min, allowing for reperfusion. In group 3, the intragastric pressure and gastric volvulus was maintained for 210 min.
The abdominal cavity was closed with multiple towel clamps in all dogs and maintained in this manner except at the time of tissue sampling.
Tissue sample collection
Tissue from the gastric fundus, pylorus and jejunum were taken at 0, 120, and 210 min from each dog. Mucosal tissue samples (1.0 cm × 0.50 mm) were taken for high performance liquid chromatography (HPLC) analysis. These samples were rinsed rapidly with a sterile saline solution until free of obvious blood contamination and then immediately placed in cryotubes and placed in liquid nitrogen before being transported and stored in a freezer at −70°C. Full-thickness tissue samples (4.0 cm × 4.0 cm) were taken from the fundus and jejunum for evaluation of mucosal conductance and were immediately placed in chilled Ringer’s solution that had been aerated with 95% O2 and 5% CO2 for 10 to 20 min. The samples were then transported immediately to the laboratory for further preparations and mounting in the Ussing chambers. Full-thickness tissue samples were taken from the fundus, pylorus, and jejunum and stored in neutral buffered 10% formalin for microscopic evaluation. The stomach and jejunum were sutured after samples were obtained and inflation was adjusted when necessary. All dogs were euthanized after 210 min using Beuthanasia solution (D Special; Schering-Plough Animal Health, Union, New Jersey, USA) at 2 mL/10 kg BW, IV.
Hemodynamic measurements and blood sampling
Electrocardiogram, mean arterial pressure, portal pressure, and central venous pressure were continuously measured (Passport Datascope 5 Lead, 5 L; XG, Paramus, New Jersey, USA). Arterial blood gas samples were obtained and analyzed at 0, 120, and 210 min. Blood sampling for packed cell volume and total protein was done every 15 min for 210 min.
High performance liquid chromatography
Tissue samples obtained for ATP quantification using HPLC were stored in a −70°C freezer. These samples were lyophilized (FreeZone 4.5 liter freeze dry system, Model 77510; Labconco Corporation, Kansas City, Missouri, USA) within 24 h after collection. The extraction method used was adapted from techniques previously described (11,12) and was validated in our laboratory for use in canine tissue. On the day of analysis, frozen tissue samples were weighed (7 to 13 mg dry weight) in duplicate from the parent sample and placed in individual 10 mL conical tubes. Calculations were performed for each sample and ice cold perchloraic acid (1 mL of 0.6 N HClO4/1.5 mg of tissue dry weight) was added to each sample. The samples were then homogenized using a tissuemizer (Ultra-turrax; Tekmar Corporation, Cincinnati, Ohio, USA). The tissuemizer was cleaned using HPLC water and methanol between each sample. The samples were maintained on ice, capped, and centrifuged at 0°C at 1500 × g for 12 min. Then, 1200 μL of each tissue extract was placed into individually labeled 5 mL conical glass tubes on ice and 800 μL of iced cold potassium bicarbonate was added dropwise to each conical tube. The tubes were vortexed until mixed and capped. The samples were then centrifuged at 0°C at 1000 × g for 15 min.
Neutralized samples were filtered through a nylon filter (Nalgene 4 mm syringe filters #176-0045; Nalge Company, Rochester, New York, USA) into HPLC vials. The HPLC vials were loaded into auto-sampler magazines and the ATP, ADP, and AMP were separated by HPLC using a 5 μm column (Adsorbosphere C18 5U column, Direct-connect prefilter kit #28689, All-guard cartridge system #96041; Alltech Associates, Deerfield, Illinois, USA). Detection was performed by a diode-array detector (HP 1090 liquid chromatograph; Agilent Technologies, Wilmington, Delaware, USA) set at a peak wavelength of 260 nm. The peaks were quantified by area under the curve and compared against peak areas of known standards of ATP, ADP, and AMP. The concentrations were expressed as mg/dL of tissue extract.
Validation in canine tissue
The isolation and extraction of ATP, ADP, and AMP was evaluated in our laboratory, observing the recovery of tissue-spiked samples to standard samples. Tissue harvested from the fundus and jejunum of a normal dog was processed as described above. Known amounts of ATP, ADP, and AMP were added to the tissue samples and compared to known standards. A positive, linear correlation would show that extraction from canine gastric and jejunum mucosa was possible without interference from tissue components, such as fats, proteins, or other complex structures.
Ussing chambers
The full-thickness samples were pinned to a rubber surface, with the mucosal surface up and submerged in a Krebs-Ringer-bicarbonate (KRB) solution at room temperature. The KRB used to bathe all tissues contained 142 mM Na, 5 mM K, 1.25 mM Ca, 1.1 mM Mg, 124 mM Cl, 25 mM HCO3, 1.65 HPO4, 10 mM glucose and 0.3 mM H2PO4. While the tissue was gassed continuously in the solution with a 95% O2 and 5% CO2 gas mixture, dissection was performed using fine dissecting scissors to carefully remove the mucosal layer. These mucosal segments were then mounted in Ussing chambers (Ussing chamber; World Precision Instruments, Sarasota, Florida, USA) with 3.14 cm2 exposed surface area. The tissue was bathed on both sides with 10 mL of KRB solution circulated with 95% O2 and 5% CO2. A temperature of 37°C was maintained.
Transepithelial short-circuit, electrical potential difference, and conductance were monitored with an automatic voltage clamp amplifier (DVC — 1000; World Precision Instruments, New Haven, Connecticut, USA). Transepithelial short circuit and potential difference were measured and recorded every 15 min for 180 min. Tissue conductance was calculated as the ratio of short-circuit current to open circuit potential difference and was expressed as mS/cm2 (milli-Siemans per cm squared). The conductance for each tissue sample was standardized according to its baseline value.
Microscopic evaluation
Tissue samples were stored in neutral buffered 10% formalin until they were routinely processed with paraffin and stained with hematoxylin and eosin stain. One pathologist, blinded to the treatments, reviewed all slides.
Statistical method
All hemodynamic and hematologic variables, and the concentrations of ATP, ADP, and AMP were considered continuous. In addition, the energy charge (ATP + 1/2ADP/ATP + ADP + AMP/no units) was also calculated (13,14) and considered continuous. All continuous data followed a normal distribution as noted by failure to reject the null hypothesis of normality at P ≤ 0.05 using the Shapiro-Wilk test. The data was summarized as mean ± standard error of means (sχ̄). The data was evaluated for an effect of treatment and time using a mixed linear model accounting for the random variance of dog and the repeated measurements on each dog. Where there were significant interaction effects at P ≤ 0.05, predetermined multiple comparisons were made across time within each treatment group using least squares means maintaining type I error at 0.05. This comparison thus described the behavior of the variable over time within each group. For hemodynamic and hematologic variables, comparisons were only made to baseline. Treatment groups that behaved differently over time thus implied the treatments were different. Where a difference is noted for any result, unless specified, P ≤ 0.05.
For the purpose of analysis, the standardized conductance recorded over the duration of evaluation (180 min) was plotted for each tissue sample and the area under the curve (conductance-time) was calculated using the trapezoid method (15). The standardized conductance-time thus reflected the magnitude of the conductance over the duration of evaluation in the Ussing chamber and was the measurement used for statistical analysis. The standardized conductance-time was considered continuous and followed a normal distribution as noted by failure to reject the null hypothesis of normality at P ≤ 0.05 using the Shapiro-Wilk test. The conductance-time data was summarized as mean ± sχ̄. The data was evaluated as described above.
PROC UNIVARIATE, PROC MEANS, and PROC MIXED (SAS, version 8.2; SAS Institute, Cary, North Carolina, USA) were used.
Results
Standard curve generation and calibration for ATP, ADP, and AMP was evaluated each time samples were run and linear correlation coefficients between standard concentration and peak area > 0.995 were necessary before being acceptable in our laboratory. Most standards were generated with a > 0.9995 calibration tolerance. Tissue-spiked samples from the fundus and jejunum of a normal dog, when compared to known standards, showed positive, linear correlations. This showed that extraction was possible from canine gastric and jejunum mucosa without interference from tissue components, such as fats, proteins, or other complex structures. The linear correlations between spiked canine gastric and jejunal mucosa and known standards for ATP, ADP, and AMP had linear correlation coefficients > 0.99 (0.991, 0.994, 0.996 gastric; 0.992, 0.995, 0.994 jejunum, respectively).
Adenosine triphosphate, ADP, AMP
For the fundus, ATP concentration did not change over time in group 2 (Figure 1). The ATP concentration increased significantly from baseline at 210 min in the group 1 (2.59 ± 0.32 to 3.73 ± 0.30 μg/dL). The ATP concentration decreased significantly from baseline to 210 min in group 3 (1.90 ± 0.27 to 1.17 ± 0.17 μg/dL). The ADP concentration increased significantly from baseline to 120 min in group 1 (0.64 ± 0.08 to 1.00 ± 0.11 μg/dL), followed by a decrease in the mean concentration from 120 and 210 min (Figure 2). However, the decrease was not significant, yet equivalent, to baseline concentrations. The ADP concentration did not change over time in groups 2 and 3. The AMP concentration decreased significantly from baseline to 120 min (0.80 ± 0.49 to 0.26 ± 0.05 μg/dL) and remained significantly decreased at 210 min in group 2 (0.32 ± 0.04 μg/dL) (Figure 3). The AMP concentration did not change over time in groups 1 or 3. Energy charge did not change over time for groups 1 or 2 (Figure 4). Energy charge decreased significantly from baseline to 120 min (0.84 ± 0.01 to 0.63 ± 0.06) and remained significantly decreased from baseline at 210 min (0.68 ± 0.04) in group 3.
Figure 1.
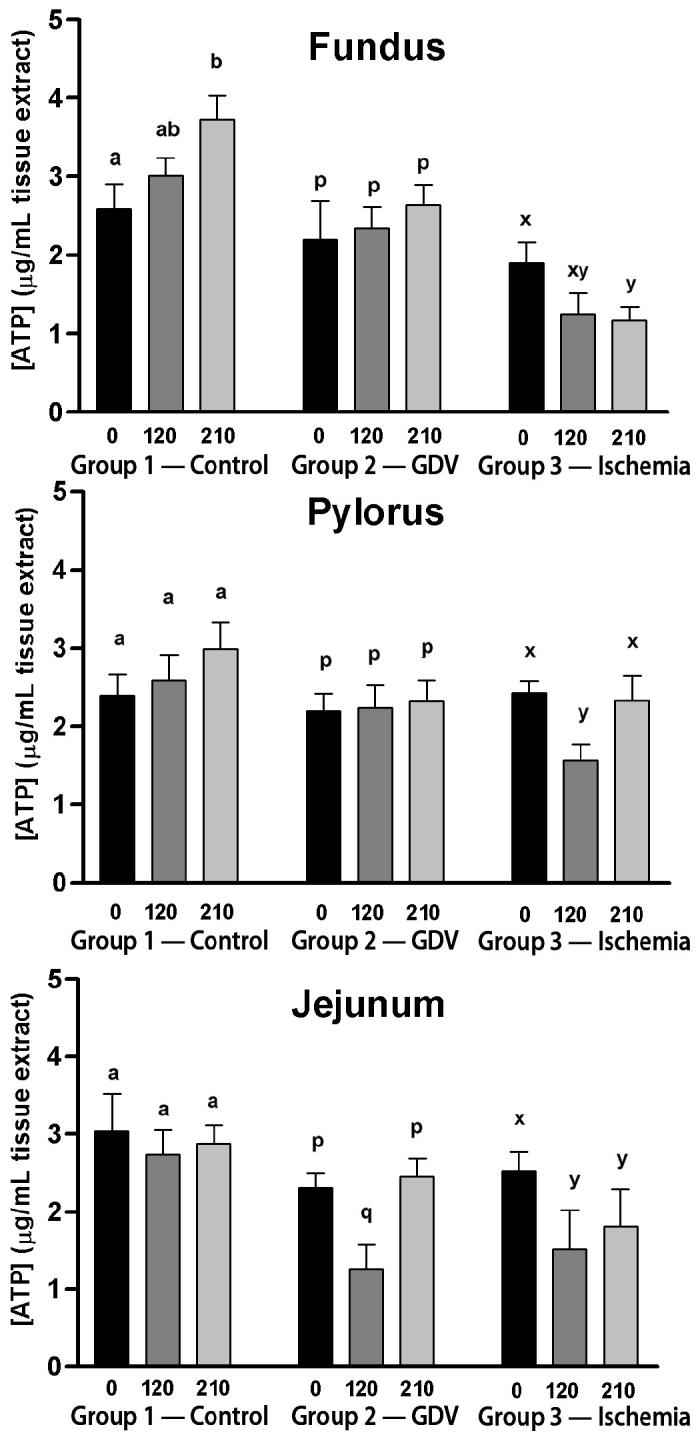
Mean (± standard error of means [sχ̄]) concentration of adenosine triphosphate (ATP) (μg/mL) in the fundus, pylorus, and jejunum of dogs in group 1 (control), group 2 (experimentally induced gastric dilation-volvulus [GDV]), and group 3 (experimentally induced ischemia). For each site, comparisons within each group were considered significant at P ≤ 0.05, as indicated by different superscripts.
Figure 2.
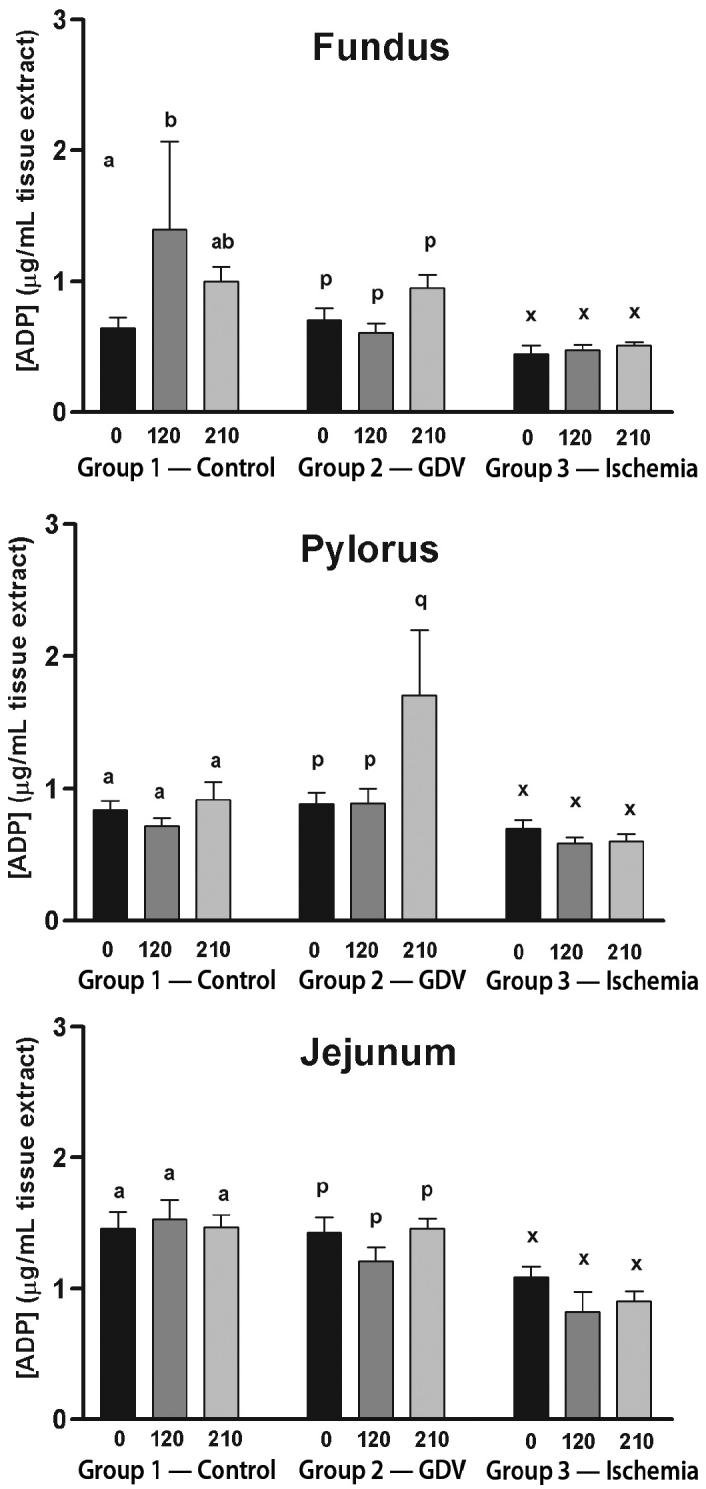
Mean (± standard error of means [sχ̄]) concentration of adenosine diphosphate (ADP) (μg/mL) in the fundus, pylorus, and jejunum of dogs in group 1 (control), group 2 (experimentally induced gastric dilation-volvulus [GDV]), and group 3 (experimentally induced ischemia). For each site, comparisons within each group were considered significant at P ≤ 0.05, as indicated by different superscripts.
Figure 3.
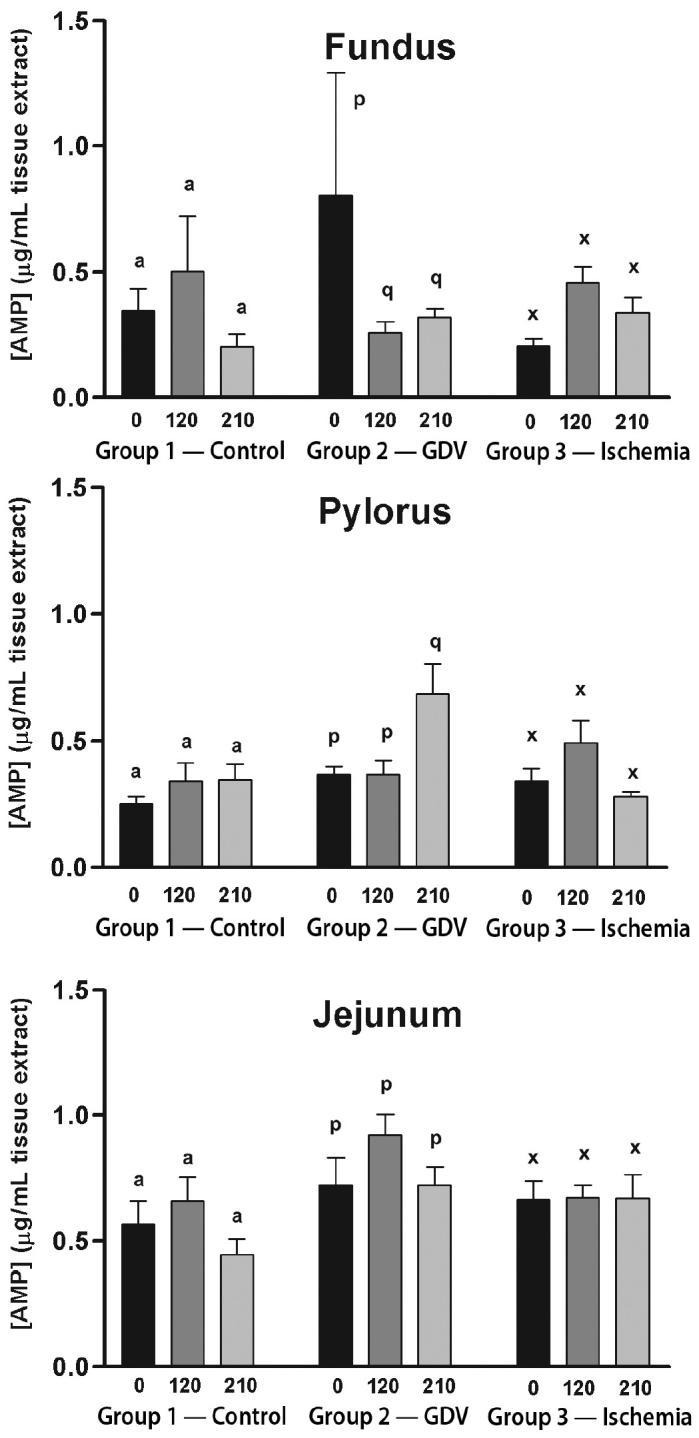
Mean (± standard error of means [sχ̄]) concentration of adenosine monophosphate (AMP) (μg/mL) in the fundus, pylorus, and jejunum of dogs in group 1 (control), group 2 (experimentally induced gastric dilation-volvulus [GDV]), and group 3 (experimentally induced ischemia). For each site, comparisons within each group were considered significant at P ≤ 0.05, as indicated by different superscripts.
Figure 4.
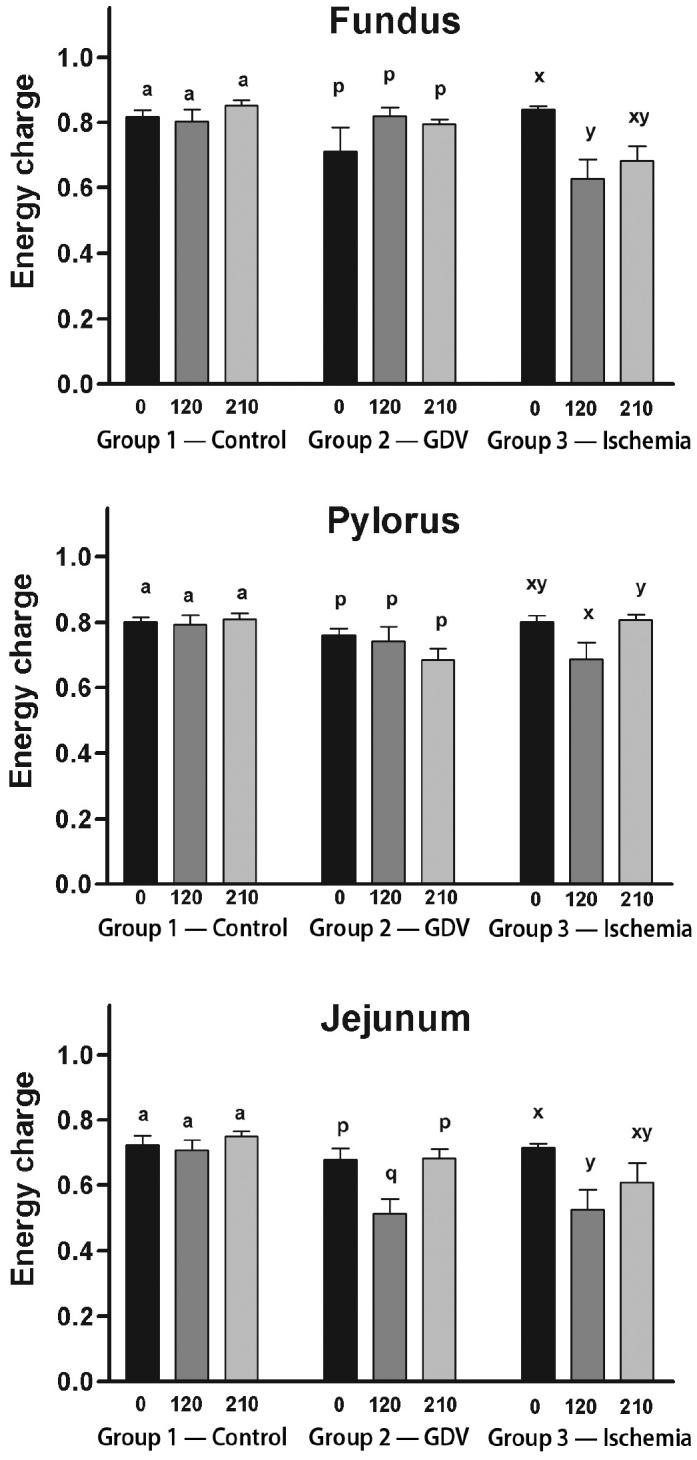
Mean (± standard error of means [sχ̄]) energy charge (ATP + 1/2ADP/ATP + ADP + AMP) in the fundus, pylorus, and jejunum of dogs in group 1 (control), group 2 (experimentally induced gastric dilation-volvulus [GDV]), and group 3 (experimentally induced ischemia). For each site, comparisons within each group were considered significant at P ≤ 0.05, as indicated by different superscripts.
For the pylorus, ATP concentration did not change over time in groups 1 or 3, but decreased significantly from baseline at 120 min in group 3 (Figure 1). The ADP concentration increased significantly from baseline and 120 to 210 min in group 2 (0.88 ± 0.09/0.89 ± 0.11 to 1.71 ± 0.49 μg/dL) (Figure 2). The ADP concentration did not change over time in groups 1 or 3. The AMP increased significantly from baseline and at 120 to 210 min in group 2 (0.37 ± 0.03/0.37 ± 0.06 to 0.69 ± 0.12 μg/dL) (Figure 3). The AMP concentration did not change over time in groups 1 or 3. Energy charge did not change over time for groups 1 or 2 (Figure 4). Energy charge significantly decreased from baseline to 120 min (0.80 ± 0.02 to 0.69 ± 0.05) and returned to baseline at 210 min (0.81 ± 0.02) for group 3.
For the jejunum, ATP concentration did not change over time in group 1 (Figure 1). The ATP concentration decreased significantly from baseline to 120 min in group 2 (2.31 ± 0.19 to 1.26 ± 0.32 μg/dL) and group 3 (2.54 ± 0.24 to 1.52 ± 0.51 μg/dL). The ATP concentration returned to baseline at 210 min in group 2 (2.46 ± 0.23 μg/dL) but remained significantly decreased at 210 min in group 3 (1.81 ± 0.49 μg/dL). The ADP and AMP concentrations did not change over time in any of the groups (Figures 2 and 3). Energy charge did not change over time for group 1 (Figure 4). Energy charge significantly decreased from baseline to 120 min in group 2 (0.68 ± 0.03 to 0.51 ± 0.04) and group 3 (0.71 ± 0.01 to 0.52 ± 0.06), and returned to baseline at 210 min in group 2 (0.68 ± 0.03) but remained significantly decreased below baseline in group 3 (0.61 ± 0.06).
Tissue conductance
For the fundus, conductance-time did not change over time in any of the groups (Figure 5).
Figure 5.
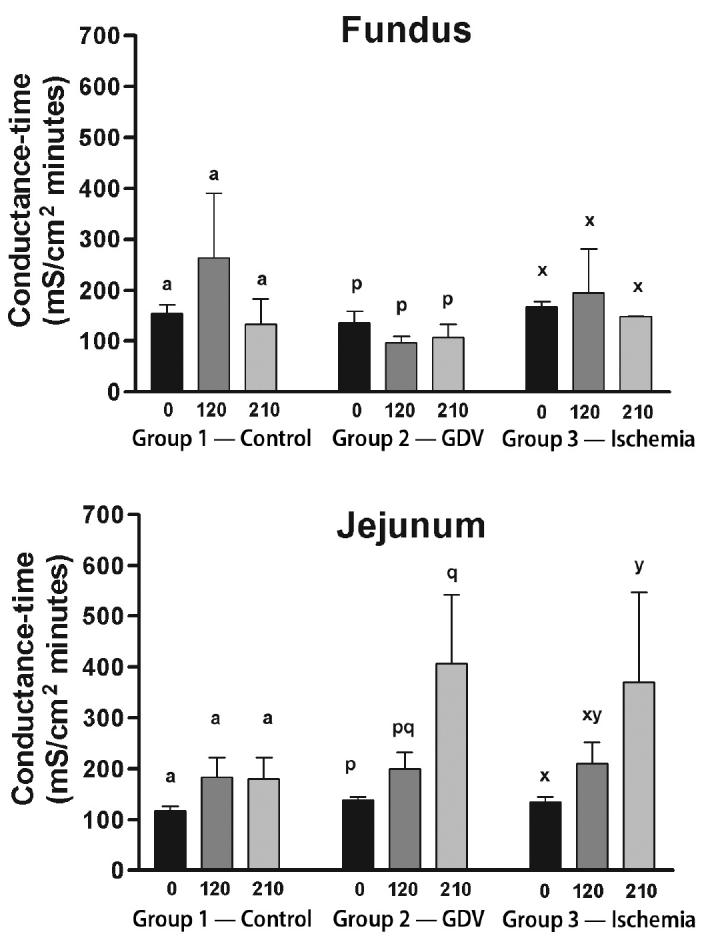
Mean (± standard error of means [sχ̄]) conductance-time in the fundus and jejunum of dogs in group 1 (control), group 2 (experimentally induced gastric dilation-volvulus [GDV]), and group 3 (experimentally induced ischemia). For each site, comparisons within each group were considered significant at P ≤ 0.05, as indicated by different superscripts.
For the jejunum, conductance-time did not change over time in group 1 (Figure 5). Conductance-time increased significantly above baseline at 210 min in group 2 (138.40 ± 6.28 to 406.70 ± 135.54 mS/cm2 min) and group 3 (134.80 ± 18.85 to 370.10 ± 177.10 mS/cm2 min).
Hemodynamics and arterial blood gas
No cardiac arrhythmias were noted in any of the dogs. Hemodynamic changes occurred in all dogs. The mean arterial pressure decreased significantly below baseline from 15 to 210 min in groups 1 and 3. The mean arterial pressure decreased significantly below baseline from 90 to 210 min in group 2. The portal pressure did not change significantly from baseline in group 1. The portal pressure significantly increased above baseline after 15 min in group 3 and remained increased until 210 min. The portal pressure increased significantly above baseline after 15 min in group 2 and remained increased above baseline until 120 min. The portal pressure then decreased at 135 min and was not significantly different from baseline between 135 to 210 min in group 2 (Figure 6).
Figure 6.
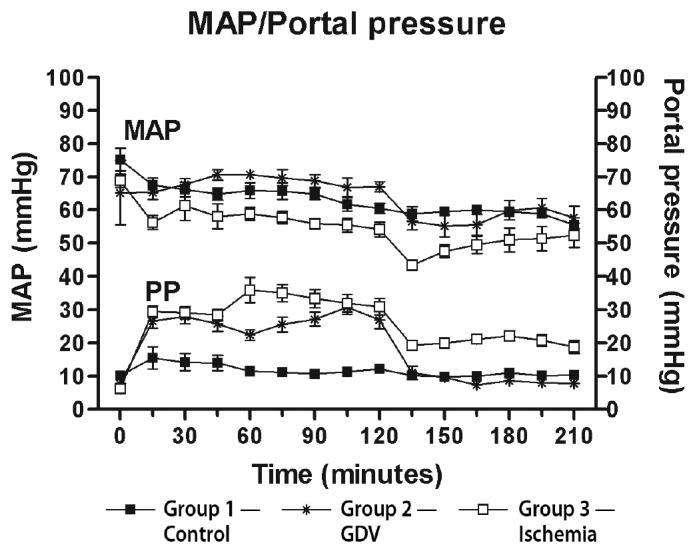
Mean (± standard error of means [sχ̄]) arterial pressure (MAP) and portal pressure (PP) from dogs in group 1 (control), group 2 (experimentally induced gastric dilation-volvulus [GDV]), and group 3 (experimentally induced ischemia). The MAP was significantly decreased below baseline from 15 to 210 min in groups 1 and 3 and from 90 to 210 min in group 2. The PP was significantly decreased below baseline from 15 to 210 min in group 3 and from 15 to 120 min in group 2. All other time points were not significantly different from baseline.
The packed cell volume (PCV) did not change significantly from baseline in any of the groups. The total protein (TP) did not change significantly from baseline in group 1. The TP decreased significantly below baseline from 195 to 210 min in group 3 and from 135 to 210 min in group 2 (Figure 7).
Figure 7.
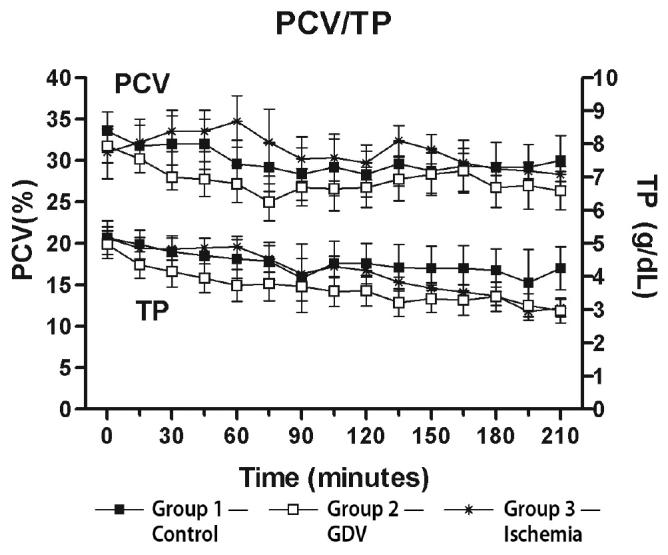
Mean (± standard error of means [sχ̄]) packed cell volume (PCV) and total protein (TP) from dogs in group 1 (control), group 2 (experimentally induced gastric dilation-volvulus [GDV]), and group 3 (experimentally induced ischemia). The TP was significantly decreased below baseline from 195 to 210 min in group 3 and from 135 to 210 min in group 2. All other time points were not significantly different from baseline.
No appreciable difference was seen between groups in arterial blood gas parameters. A mild metabolic acidosis was seen in some dogs, but arterial pH, PaO2, and PaCO2 were within normal limits for most anesthetized dogs.
Microscopic changes
No microscopic changes were seen in the fundus, pylorus, or jejunum of group 1. Mild to moderate edema and congestion were noted in all layers, especially the mucosa, of the fundus in groups 2 and 3. No appreciable differences between groups 2 and 3 were noted in the character and severity of microscopic changes of the stomach. Moderate edema and severe congestion were noted in the jejunum. In group 3, this congestion was noted primarily in the lamina propria of the mucosal layer. Other jejunal lesions common to groups 2 and 3 included loss of glands, crypts, and villous epithelium (Figures 8 and 9).
Figure 8.
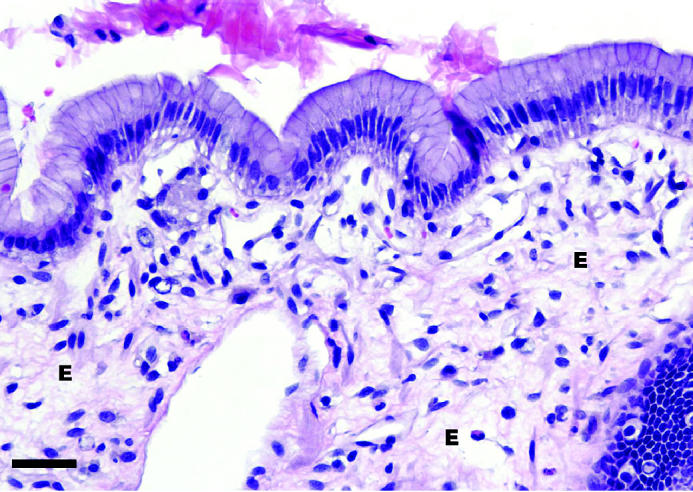
Microscopic appearance of the gastric mucosa from a dog from group 3 with experimentally induced ischemia. Note the severe edema (E) within the lamina propria beneath the mucosal epithelial cell layer. 40 × magnification. Bar = 20 μm.
Figure 9.
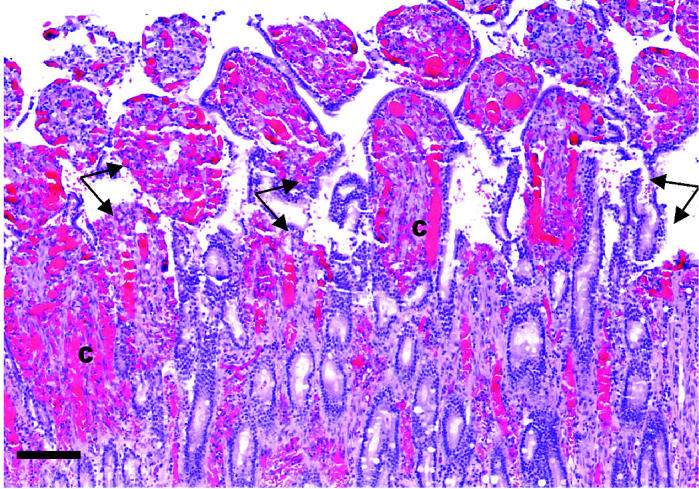
Microscopic appearance of jejunal mucosa from a dog from group 3 with experimentally induced ischemia. Note the severe congestion (C) within the blood vessels of the villi and lamina propria. There is disruption of the villi and crypts (Arrows). Hematoxylin and eosin stain. 10 × magnification. Bar = 80 μm.
Discussion
The most striking result of this study was that the hypothesized cellular changes in the gastrointestinal mucosa after experimental induction of GDV were more profound in the jejunum than the fundus. While a decrease in ATP concentration in the fundus of group 3 was observed, this occurred only after 210 min of dilation and volvulus and was not observed in the dogs in group 2 that underwent 120 min of experimentally induced GDV. If the energy charge is considered, group 3 showed an earlier change with a significant decrease at 120 min in both the fundus and the pylorus. The energy charge for group 2 did not change. This apparent decrease in cellular energy availability did not coincide with any changes in mucosal conductance in the fundus. In contrast, there were profound decreases in jejunal ATP concentration in both groups 2 and 3 after rotation of the stomach, and recovery to baseline concentrations after derotation and perfusion in group 2. The changes in overall energy charge mirrored the changes in ATP concentration. This decrease in jejunal ATP concentration and energy charge did parallel an increase in mucosal conductance in these dogs although, interestingly, despite a recovery in ATP concentration and energy charge in group 2, the mucosal conductance continued to increase.
The ATP was measured in these dogs to assess mucosal cell metabolic status. Under aerobic metabolism, degradation of glucose to carbon dioxide and water is the principal source of ATP used for cellular functions, such as active membrane transport and mitochondrial activity. The ATP is replenished under aerobic conditions by oxidative phosphorylation and conversion of ADP within the mitochondria (16). This is an efficient process with a maximum of 38 molecules of ATP formed for each molecule of glucose degraded. During organ ischemia, anaerobic glycolysis is activated. This is an inefficient system for the synthesis of ATP (17) and ATP utilization exceeds production, resulting in decreased intracellular ATP concentrations (18). With oxygen unavailable, lactic acid accumulates in the cell and the glycolytic pathway is blocked. Depletion of intracellular energy (ATP) and subsequent inhibition of ATP-dependent cellular functions, such as sodium and potassium channels, are implicated in the alterations of cell membrane transport that occur during ischemia. These alterations lead to the failure to maintain ionic gradients and membrane structural integrity (19,20).
Thus, it was hypothesized that gastrointestinal mucosal ischemia and subsequent cellular hypoxia induced by GDV would cause a depletion of cellular ATP, which in turn would lead to alterations in cell membrane transport. It was postulated that this cellular change would be reflected by an increase in cell membrane conductance. Total tissue conductance was measured in this study, which indirectly assesses cell membrane permeability and reflects the contribution of both active and passive ion movements (21). An increase in total tissue conductance may reflect stimulation of active transport (which would require ATP) by some unknown mechanism during GDV or an increase in passive diffusion, which would reflect deterioration of mucosal cell tight-junctions.
How well the ATP concentration, cellular damage, mucosal permeability, and mucosal conductance parallel is unclear. The ATP concentrations and energy charge in tissues have been proposed as markers of the extent of ischemic injury, as well as indicators of organ recovery, but with equivocal results (14,22). In addition, tissue concentrations of ATP and its metabolites do not appear to be an indicator of ischemia duration and do not correspond to morphological changes (13,23). The measurement of ATP in this study does not quantify the concentration per cell but is an overall representation of mucosal content. It may reflect a high concentration in a few cells or a low concentration in many cells. Energy charge is used to reflect the overall energy status of the tissue, taking into account the contribution of ADP and AMP (14). It is obvious that some cells in the jejunum were still capable of ATP synthesis, evidenced by the restoration of baseline ATP concentration and energy charge after derotation and reperfusion. This change may reflect a profound increase in the ATP concentration of a few cells, which possibly have undergone an almost rebound effect, particularly in face of the now aerobic synthesis of ATP from abundant ADP and AMP precursors. Lactic acid concentration or creatine phosphate in the mucosa was not measured in this study but may have lent a perspective of the effect of hypoxia on the mucosal cells. Creatine phosphate has been shown to be an indicator of ischemia in muscular tissues (24). Serum lactic acid concentrations have been measured in clinical cases of GDV and appear to be increased in dogs with gastric necrosis. However, since serum lactic acid was measured, this may reflect an overall metabolic acidotic state rather than be related to the gastric mucosa specifically (25).
The increase in jejunal conductance in both groups 2 and 3 during the first 120 min did parallel a decrease in ATP concentration, which might reflect an unknown stimulation of the active transport mechanisms with concurrent consumption of ATP. Conversely, it could reflect cellular ATP depletion due to ischemic conditions and subsequent membrane dysfunction with uncontrolled passive ion transfer due to tight-junction disruption. After reperfusion, during which the ATP concentration returned to normal in group 2, the conductance remained increased above baseline. When combining these results with the microscopic findings, it would suggest that passive transport is affected and it is more likely that the changes in mucosal conductance reflect a decrease in cell membrane function. Additional samples assessed for unidirectional mannitol flux would have been useful to directly assess mucosal permeability and differentiate the conductance findings (26); however, we were restricted in the number of samples that could be harvested without interfering with the ongoing in vivo experiment and further sampling.
The fact that the jejunal cellular conductance continued to increase in group 2, despite the restoration of ATP concentrations, may suggest cellular effects from other sources beside energy depletion. Damage from oxygen-derived free radicals produced during reperfusion may be involved (24,25). Ongoing cell death after reperfusion has been proposed as a factor in studies evaluating equine intestinal ischemia. In a model of venous strangulating obstruction in the equine jejunum, reperfusion after venous occlusion produced similar, although less severe, changes than prolonged venous occlusion (27). In a study of no-flow ischemia experimentally induced by 720 degrees of volvulus of the ascending colon in ponies, ATP content of the colonic tissue was reduced by 92% after 120 min of ischemia and recovered to 44% of controls after derotation and 120 min of reperfusion (28).This result and other results in this study led these investigators to also conclude that much of the damage seen during the reperfusion may be a continuation of injury induced during the ischemic period and not specific to reperfusion per se.
Changes in ADP and AMP during this study were variable and did not follow any patterns that could be associated with ATP concentrations. It might be expected that during ischemia, as ATP is broken down, the concentration of ADP and AMP may increase. However, ADP and AMP could also be utilized. It might also be expected, as ATP increases after reperfusion, that ADP and AMP may decrease as they are used to synthesize ATP. Without an obvious pattern of change and without molecular labeling, it was difficult to interpret whether ADP and AMP concentrations reflected the process of synthesis or breakdown. Energy charge was calculated to account for the contribution of ADP and AMP to the overall energy status of the mucosa. Where there were profound changes in the ATP concentration, such as in the jejunum, energy charge mirrored these changes, as expected (14); however, where changes were less pronounced, the energy charge was more sensitive, as was observed in the fundus results of group 3.
An unexpected finding was the significant increase in ATP concentration seen in the fundic mucosa in group 1. The reason for this is unclear. This may represent a spurious shift to ATP synthesis in these animals, as there was a slight decrease in ADP and AMP concentrations at this time and energy charge was not affected. Since a substantial amount of blood was extravasated after biopsies, red cell breakdown and absorption of intraluminal ATP by the mucosal cells, if possible, could have been an additional source of ATP and may have elevated the ATP concentration of the gastric mucosa. If in fact the increase seen in group 1 should have been expected in groups 2 and 3, then the overall decrease in ATP concentration seen in group 3 is actually more profound than simply the decrease observed from baseline and a decrease equal to this amount, whatever that may be, may have occurred in group 2.
The experimental model used in this study causes per-acute GDV. The decision to maintain intragastric pressure at 30 mmHg, apply 235 degrees of volvulus, and the duration of the ischemic time periods were based upon previous experiments (6,7,30). Our model most closely resembled that of Davidson et al (7) and hemodynamic, gross, and microscopic changes in our study were consistent with that study. Although changes in ATP content and cellular conductance were not seen in the fundus, overall energy charge changes were seen and assessment of changes in microscopic features and hemodynamic parameters, support that the experimental model was severe. The microscopic changes in the stomach and jejunum showed edema and congestion primarily in the mucosal layer. Thus, although minimal changes in ATP and mucosal conductance were seen in the gastric mucosa, the authors believe this datum is a true reflection of the changes of this model. It is important to remember that this is a per-acute experimental model. How this per-acute model extends to the clinical disease and the full-thickness integrity loss of the fundus that is seen in some dogs is unknown. The authors believe gastric necrosis to be a different, possibly later phenomenon, and may be related to thromboembolic episodes. In many clinical cases, by the time the jejunum is assessed, the stomach has been decompressed and repositioned, and portal and caval compression have been alleviated. Any abnormal gross changes in the jejunum quickly recover after gastric decompression and repositioning and the authors caution that while the jejunum may appear normal in these cases, it is important to realize that mucosal changes have occurred.
Hemodynamic changes in this model were profound with significant decreases in mean arterial blood pressure and increases in portal pressure during gastric dilation and volvulus. The reason for the decrease in mean arterial blood pressure in group 1 is likely related to anesthesia and since the mean arterial blood pressure rarely went below 60 mmHg in these dogs, they did not benefit from the higher intravenous fluid administration rates that were given to groups 2 and 3. The higher fluid administration rates may have accounted for the significant drop in total protein of groups 2 and 3, although the PCV did not appear diluted. A possible explanation would be protein loss into the gastrointestinal lumen.
The significance of the findings of this study relate to the per-acute period and suggest that changes in jejunal mucosal activity is an important event. While the focus of clinical and experimental research is generally on the stomach and implicate it as the major source of pathophysiologic changes in GDV, changes in the jejunum may play an equal or more significant role. The measurement of cellular ATP concentration in mucosa does not give a clear indication of overall cell function and does not directly relate to changes in conductance.
Acknowledgments
This study was supported by the Department of Veterinary Clinical Sciences Organized Research Fund.
Footnotes
Dr. Teten’s current address is Aelous Animal Hospital and Equine Center, 145 Harmony Lane, Manchester Center, Vermont 05255, USA.
Presented in part at the 2002 Annual Meeting of the American College of Veterinary Surgeons meeting, San Diego, California, USA.
This paper represents partial fulfillment of a Masters of Science thesis.
References
- 1.Glickman LT, Lantz GC, Schellenberg DB, et al. A prospective study of survival and recurrence following the acute gastric dilatation-volvulus syndrome in 136 dogs. J Am Anim Hosp Assoc. 1998;34:253–259. doi: 10.5326/15473317-34-3-253. [DOI] [PubMed] [Google Scholar]
- 2.Glickman LT, Glickman NW, Schellenberg DB, et al. Incidence of and breed-related risk factors for gastric dilatation-volvulus in dogs. J Am Vet Med Assoc. 2000;216:40–45. doi: 10.2460/javma.2000.216.40. [DOI] [PubMed] [Google Scholar]
- 3.Brockman DJ, Washabau RJ, Drobatz KJ. Canine gastric dilatation/volvulus syndrome in a veterinary critical care unit: 295 cases (1986–1992) J Am Vet Med Assoc. 1995;207:460–464. [PubMed] [Google Scholar]
- 4.Brourman JD, Schertel ER, Allen DA, et al. Factors associated with perioperative mortality in dogs with surgically managed gastric dilatation-volvulus: 137 cases (1988–1993) J Am Vet Med Assoc. 1996;208:1855–1858. [PubMed] [Google Scholar]
- 5.Matthiesen DT. Partial gastrectomy as treatment of gastric volvulus. Results in 30 dogs. Vet Surg. 1985;14:185–93. [Google Scholar]
- 6.Lantz GC, Bottoms GD, Carlton WW, et al. The effect of 360° gastric volvulus on the blood supply of the nondistended normal dog stomach. Vet Surg. 1984;13:189–196. [Google Scholar]
- 7.Davidson JR, Lantz GC, Salisbury SK, et al. Effects of flunixin meglumine on dogs with experimental gastric dilatation-volvulus. Vet Surg. 1992;21:113–120. doi: 10.1111/j.1532-950x.1992.tb00027.x. [DOI] [PubMed] [Google Scholar]
- 8.Chaudry IH. Use of ATP following shock and ischemia. Ann N Y Acad Sci. 1990;603:130–140. doi: 10.1111/j.1749-6632.1990.tb37667.x. [DOI] [PubMed] [Google Scholar]
- 9.Guyton AC. Metabolism of carbohydrates and formation of adenosine triphosphate. In: Guyton AC ed. Textbook of Medical Physiology. 8th ed. Philadelphia: WB Saunders, 1991:744–753.
- 10.Strombeck DR, Guilford WG. Gastric dilatation, gastric dilatation-volvulus and chronic gastric volvulus. In: Guilford WG, ed. Small Animal Gastroenterology, Vol 2. Davis: Stonegate. 1990: 228–243.
- 11.Wynants J, Van Belle H. Single-run high-performance liquid chromatography of nucleotides, nucleosides, and major purine bases and its application to different tissue extracts. Anal Biochem. 1985;144:258–266. doi: 10.1016/0003-2697(85)90114-9. [DOI] [PubMed] [Google Scholar]
- 12.Tetens J. Systemic and colonic hemodynamic and vasomotor responses to adenosine triphosphate in horses. Dissertation in Veterinary Medical Sciences, Department of Comparative Biomedical Sciences. Louisiana State University: Baton Rouge, Louisiana. 2001:197–206.
- 13.Canada AT, Coleman LRJ, Fabian MA, et al. Adenine nucleotides of ischemia intestine do not reflect injury. J Surg Res. 1993;55:416–421. doi: 10.1006/jsre.1993.1162. [DOI] [PubMed] [Google Scholar]
- 14.Sumimoto K, Inagaki K, Kazuo Y, et al. Reliable indices for the determination of viability of grafted liver immediately after orthotopic transplantation. Transplantation. 1988;46:506–509. doi: 10.1097/00007890-198810000-00007. [DOI] [PubMed] [Google Scholar]
- 15.Stewart J. Calculus; Early Transcendentals. 3rd ed. Pacific Grove: Brooks/Cole Publishing Company, 1995:457–465.
- 16.Guyton AC, ed. Textbook in Medical Physiology. 9th ed. Philadelphia: WB Saunders, 1996:858–861.
- 17.Garrad R, Otero M, Gonzalez F, et al. Desensitization of the P2Y2 receptor; implications for the therapy of cystic fibrosis. Drug Dev Res. 1998;43:12. [Google Scholar]
- 18.Smart CJ, Rowlands SD. Oxygen consumption and hepatic metabolism in experimental post-hemorrhagic shock. J Trauma. 1972;12:327–334. doi: 10.1097/00005373-197204000-00009. [DOI] [PubMed] [Google Scholar]
- 19.Glynn IM. Membrane adenosine triphosphate and cation transport. British Medical Bulletin. 1968;24:165–169. doi: 10.1093/oxfordjournals.bmb.a070620. [DOI] [PubMed] [Google Scholar]
- 20.Holton F, Holton P. The possibility that ATP is a transmitter at sensory nerve endings. J Physiol. 1953;119:50–51. [PubMed] [Google Scholar]
- 21.Carey HV, Hayden UL, Tucker KE. Fasting alters basal and stimulated ion transport in piglet jejunum. Am J Physiol. 1994;267:156–163. doi: 10.1152/ajpregu.1994.267.1.R156. [DOI] [PubMed] [Google Scholar]
- 22.Lanir A, Jenkins RL, Caldwell CB, et al. Hepatic transplantation survival: Correlation with adenosine nucleotide level in donor liver. Hepatology. 1988;8:471–475. doi: 10.1002/hep.1840080306. [DOI] [PubMed] [Google Scholar]
- 23.Siems W, Kowalewski J, David H, et al. Discrpeancy between biochemical normalization and morphological recovery of jejunal mucosa during postischemic reperfusion in presence of xanthine oxidase inhibitor oxypurinol. Cell Mol Biol. 1991;37:213–216. [PubMed] [Google Scholar]
- 24.Ye J, Clark MG, Colquhoun EQ. Creatine phosphate as the preferred early indicator of ischemia in muscular tissues. J Surg Res. 1996;61:227–236. doi: 10.1006/jsre.1996.0109. [DOI] [PubMed] [Google Scholar]
- 25.de Papp E, Drobatz KJ, Hughes D. Plasma lactate concentration as a predictor of gastric necrosis and survival among dogs with gastric dilatation-volvulus: 102 cases (1995–1998) J Am Vet Med Assoc. 1999;215:49–52. [PubMed] [Google Scholar]
- 26.Nadeau JA, Andrews FM, Patton CS, et al. Effects of hydrochloric, acetic, butyric, and propionic acids on pathogenesis of ulcers in the nonglandular portion of the stomach in horses. Am J Vet Res. 2003;64:404–412. doi: 10.2460/ajvr.2003.64.404. [DOI] [PubMed] [Google Scholar]
- 27.Laws EG, Freeman DE. Significance of reperfusion injury after venous strangulation obstruction of equine jejunum. J Invest Surg. 1995;8:263–270. doi: 10.3109/08941939509031600. [DOI] [PubMed] [Google Scholar]
- 28.Parks DA, Bulkley GB, Granger DN, et al. Ischemic injury in the cat small intestine: Role of superoxide radicals. Gastroenterology. 1982;82:9–15. [PubMed] [Google Scholar]
- 29.McAnulty JF, Stone WC, Darien BJ. The effects of ischemia and reperfusion on mucosal respiratory function, adenosine triphosphate, electrolyte and water content in the ascending colon of ponies. Vet Surg. 1977;26:172–181. doi: 10.1111/j.1532-950x.1997.tb01481.x. [DOI] [PubMed] [Google Scholar]
- 30.Badylak SF, Lantz GC, Jeffries M. Prevention of reperfusion injury in surgically induced gastric dilatation-volvulus in dogs. Am J Vet Res. 1990;51:294–299. [PubMed] [Google Scholar]


