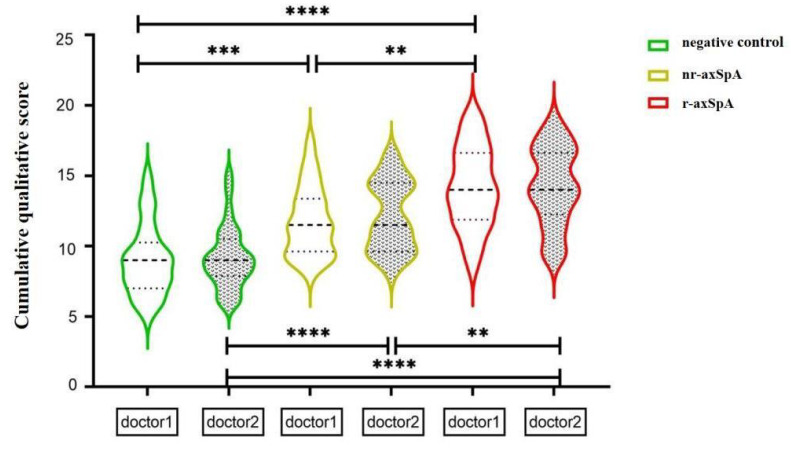
Figure 3.
Qualitative and quantitative comparison of the Likert scores of the two readers; comparison of the cumulative scores among the negative control, nr-axSpA, and r-axSpA groups, with significant differences in the average cumulative score among the groups. (****) p <0.0001, (***) p < 0.001, (**) p < 0.01.

