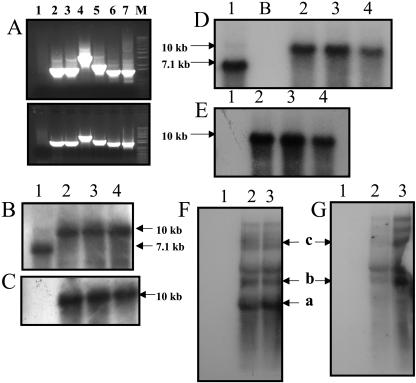
Figure 2.
A, PCR analysis of untransformed plants and putative transformants. Top section is transgenic line 4B; bottom section is transgenic line 4A. A, Lane 1, Untransformed plant; 2, 3P-3M (1.65 kb); 3, 4P-4M (1.65 kb); 4, 5P-2M (3.56 kb); 5, 5P-3′phaA (2.0 kb); 6, 5P-phaA internal (1.5 kb); 7, positive control (pLD-5′UTR-phbA plasmid DNA) 5P-phbA internal (1.5 kb); M, marker. B and D, Southern-blot analysis of T0 and T1 generation transgenic lines, respectively, with the chloroplast flanking sequence probe; 10-kb fragment shows integration of transgenes; 7.1-kb fragment shows wild-type fragment. C and E, Transgenic T0 and T1 plants, respectively, and untransformed plant probed with the phaA gene. The 10-kb fragment is observed in transgenic lines but not in the untransformed plant. F and G, Northern-blot analysis using the phaA and aadA probes, respectively. Monocistron (a, 5′UTR-phaA, 1,384 nt) and polycistrons (b, aadA-phaA, 2,255 nt; c, from native 16S Prrn, 4,723 nt) containing the phaA gene are observed in the transgenic lines when the phaA probe is used. Only polycistrons are observed with the aadA probe. In B to G: 1, untransformed plant; 2 to 4, chloroplast transgenic lines 4A, 4B, and 4C, respectively; B, blank lane.

