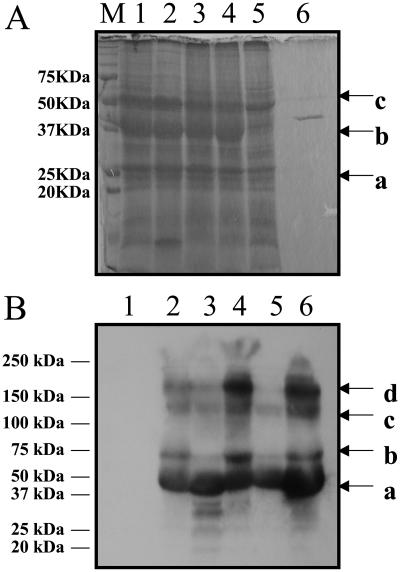
Figure 3.
β-Ketothiolase characterization in transgenic lines. A, Coomassie-stained gel showing abundant β-ketothiolase expression in transgenic lines; 15 μg of total plant protein was loaded per lane (a, D1 protein; b, β-ketothiolase, 40.8 kD; c, Rubisco large subunit, based on molecular range). M, Marker; 1 to 3, transgenic lines 4A, 4B, and 4C, respectively; 4, 4A T1 generation; 5, untransformed plant; 6, bacterial purified β-ketothiolase. B, Western-blot analysis; 10 μg of total plant protein from transgenic lines and wild type was loaded per lane; anti-β-ketothiolase antibody was used. Bands corresponding to the 40.8-kD monomers (a), a possible modified version of the monomer (b), trimer (c), or tetramer (d) are observed in transgenic lines. 1, Untransformed plant; 2 to 4, transgenic lines 4A, 4B, and 4C, respectively; 5 and 6, 4A and 4B T1 generation, respectively.

