Figure 1.
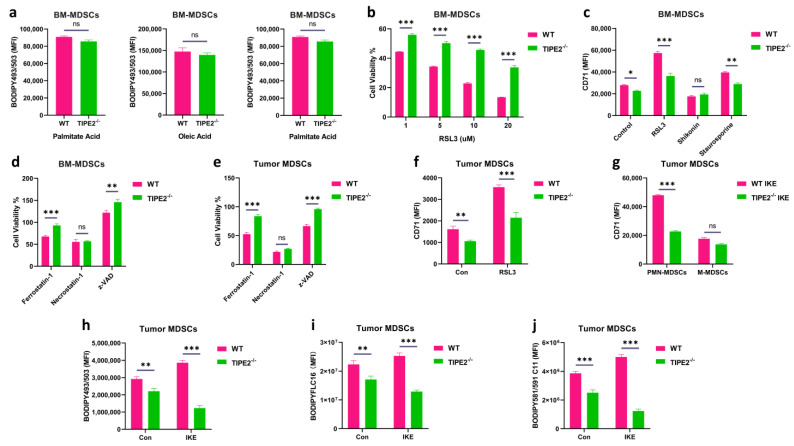
TIPE2 is involved in the induction of ferroptosis in MDSCs. (a) Fatty acid accumulation with lipophilic fluorescent dye BODIPY493/503 in Gr−1+ MDSCs extracted from the bone marrow treated with palmitate acid (saturated fatty acid, 100 μM), linoleic acid (polyunsaturated fatty acid, 100 μM), and oleic acid (monounsaturated fatty acid, 100 μM) for 48 h. Mean ± SD are shown. (b) AlamarBlue cell viability assay on Gr−1+ MDSCs extracted from the bone marrow incubated with different concentrations 1 µM, 5 µM, 10 µM, and 20 µM of RSL3 for 24 h. Mean ± SD are shown. (c) CD71 expression in Gr−1+ MDSCs extracted from the bone marrow in the presence of different cell death inducers for 18 h: ferroptosis (RSL3, 20 µM), necroptosis (Shikonin, 1 µM), and apoptosis (Staurosporine, 0.25 µM). Mean ± SD are shown. (d) AlamarBlue cell viability assay on Gr-1+ MDSCs extracted from the bone marrow in the presence of different cell death inhibitors for 24 h: 1 µM ferrostatin-1 for ferroptosis, 1 µM necrostatin−1 for necroptosis, and 10 µM z−VAD−FMK (zVAD) for apoptosis. Mean ± SD are shown. (e) AlamarBlue cell viability assay on Gr−1+ MDSCs extracted from the LLC TB mice in the presence of different cell death inhibitors for 24 h: 1 µM ferrostatin-1 for ferroptosis, 1 µM necrostatin-1 for necroptosis, and 10 µM z−VAD−FMK (zVAD) for apoptosis. Mean ± SD are shown. (f) CD71 expression in Gr−1+ MDSCs extracted from the LLC TB mice in the presence of ferroptosis inducer 10 µM RSL3 for 24 h. Mean ± SD are shown. (g) CD71 expression in PMN−MDSCs and M−MDSCs extracted from the LLC TB mice. Mean ± SD are shown. (h) Lipid level with lipophilic fluorescent dye BODIPY493/503 in Gr−1+ MDSCs extracted from the LLC TB mice treated with IKE. Mean ± SD are shown. (i) Lipid uptake with palmitic acid fluorescent dye BODIPYFLC16 in Gr−1+ MDSCs extracted from the LLC TB mice treated with IKE. Mean ± SD are shown. (j) Lipid peroxidation level with fluorescent dye BODIPY 581/591 C11 in Gr−1+ MDSCs extracted from the LLC TB mice treated with IKE. Mean ± SD are shown. (a–j) Data are expressed as *, p ≤ 0.05, **, p ≤ 0.01, ***, p ≤ 0.001, or ns, no significant difference.

