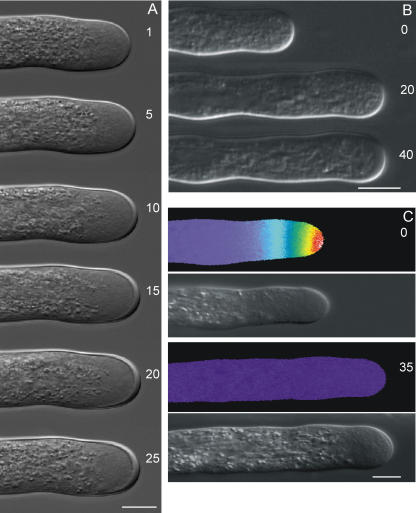
Figure 2.
Morphology of L. formosanum pollen tubes (A) and pseudocolor ratio images of intracellular Ca2+ distribution in L. formosanum pollen tubes (C) exposed to 10 units mL−1 orange peel PME. B, Morphology of N. tabacum pollen tubes exposed to 30 units mL−1. Numbers represent minutes after addition of PME to the growth medium. The [Ca2+]i gradient shown extends from 1 to 3 μm at the apex of the growing tube to basal values of around 0.15 μm within 20 μm from the apex. Scale bar = 10 μm.

