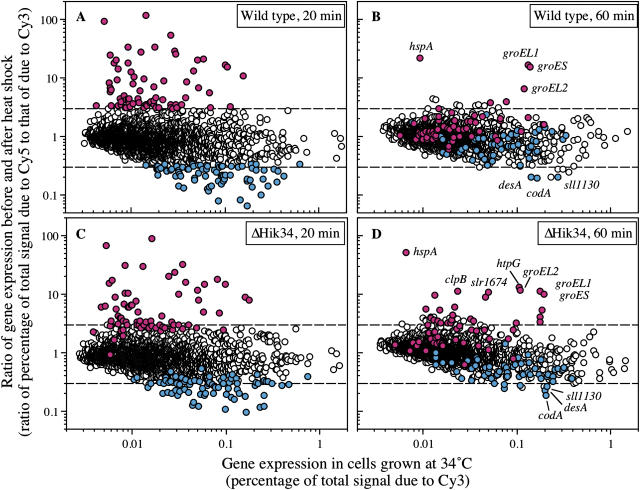
Figure 4.
DNA microarray analysis of changes in genome-wide expression of genes in response to heat shock at 44°C in wild-type cells for 20 min (A) and 60 min (B) and in ΔHik34 cells for 20 min (C) and 60 min (D). RNA extracted from cells that had been grown for 16 h at 34°C and then incubated at 44°C for 20 min or 60 min was labeled with Cy5 (as the sample) and RNA extracted from the respective cells that had not been exposed to heat shock (as the control) was labeled with Cy3. Genes whose levels of expression rose more than 3-fold and genes whose expression was suppressed to less than one-third of the control level in wild-type cells after incubation at 44°C for 20 min are indicated in red and blue, respectively. Upper and lower dashed lines indicate a 3-fold increase and a decrease to one-third, respectively. Note that the scale of the ordinate in this figure is different from that in Figure 1.

