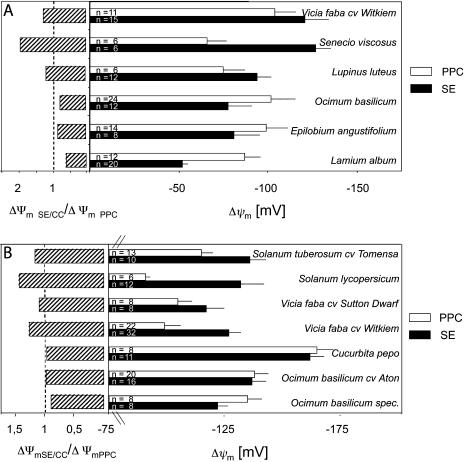
Figure 5.
A, Resting potentials (±sd) of SE/CCs and adjoining PPCs in excised tissue slices of different species (right). The number of replicates is presented in the bars. Left, Membrane potential ratios defined as ΔΨm SE/CC/ΔΨm PPC (striped bars). B, Resting potentials of SE/CCs and adjoining PPCs in transport phloem in main veins of intact plants (right). The number of replicates is presented in the bars. Left, Membrane potential ratios defined as ΔΨm SE/CC/ΔΨm PPC (striped bars).

