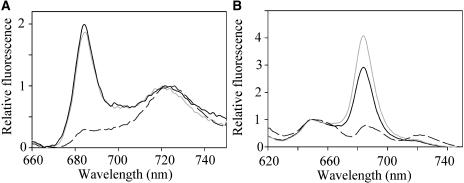
Figure 3.
Fluorescence emission spectra at 77 K for cells of Synechocystis 6803. Gray line, iron-starved cells after dark-adaptation. Black line, iron starved cells after induction of NPQ. Broken line, iron-replete cells, dark adapted. A, Excitation of chlorophyll a at 435 nm. Spectra are normalized to the PSI peak at 725 nm. B, Excitation of phycocyanin at 600 nm. Spectra are normalized to the phycocyanin peak at 650 nm.

