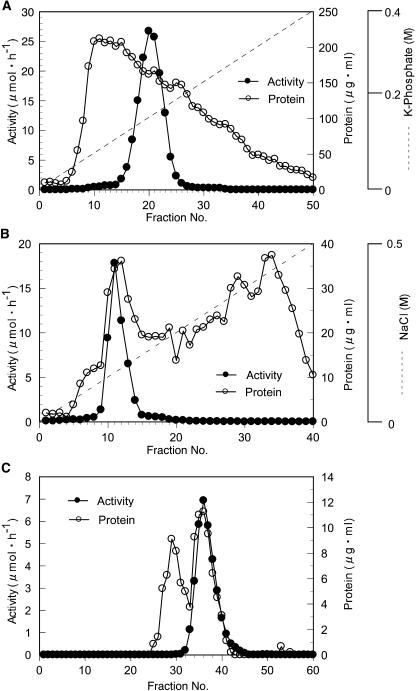
Figure 1.
Elution profiles of α-l-arafase activity by hydroxyapatite (A), Q-Sepharose (B), and Sephacryl S-200 (C) chromatography. The activity was represented by a black circle (•) and the protein by a white circle (○). Fractions eluted from hydroxyapatite were collected (fraction nos. 18–23; 36 mL), dialyzed, and loaded onto a Q-Sepharose anion-exchange column. Then fraction numbers 10 to 12 (15 mL) were collected, concentrated, and then loaded onto a Sephacryl S-200 gel-filtration chromatograph. Fractions were collected in 2-mL aliquots.

