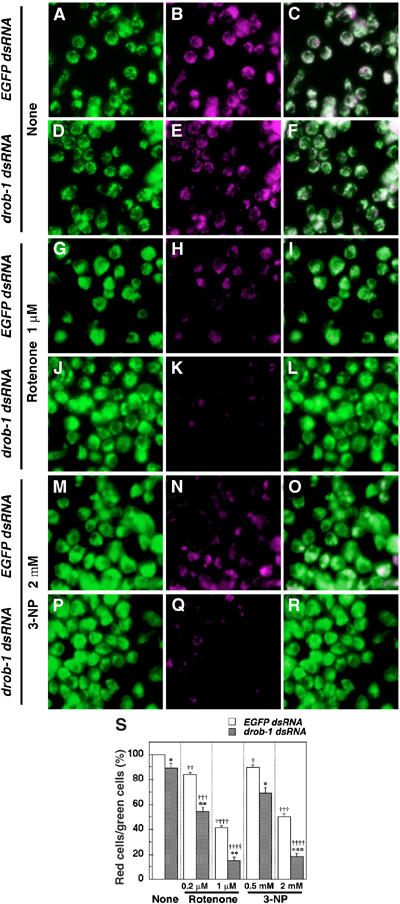
Figure 6.

Knockdown of Drob-1 enhances rotenone- or 3-NP-induced loss of mitochondrial membrane potential (Δψm) in S2 cells. (A–R) Cells were cultured with either EGFP dsRNA or drob-1 dsRNA for 48 h, and then incubated with or without rotenone (0.2 and 1 μM) or 3-NP (0.5 and 2 mM) for an additional 24 h. After the treatment, cells were labeled with Δψm-sensitive dye JC-1 and imaged with confocal microscope as described in Materials and methods. Total (inactive+active) and active mitochondria are labeled green JC-1 monomers (A, D, G, J, M, and P) and red J-aggregates (B, E, H, K, N, and Q) fluorescence, respectively (see Materials and methods). Overlay image of green and red JC-1 fluorescence is shown in panels C, F, I, L, O, and R. (S) Quantitative analysis of Δψm was performed by calculating the percentage of the number of red J-aggregates fluorescence-labeled cells out of that of total cells (green JC-1 monomers fluorescence-labeled cells) as described in Materials and methods. Each value shows the mean±s.e.m. of three independent experiments. Approximately 300 cells were analyzed per each condition in each experiment. *P<0.05, **P<0.01, and ***P<0.005 for each value as compared with EGFP dsRNA-treated cells under each experimental condition, †P<0.05, ††P<0.01, †††P<0.005, and ††††P<0.001 for each value as compared with control (cells treated with EGFP dsRNA only) by Student's t-test.
