
Figure 5.
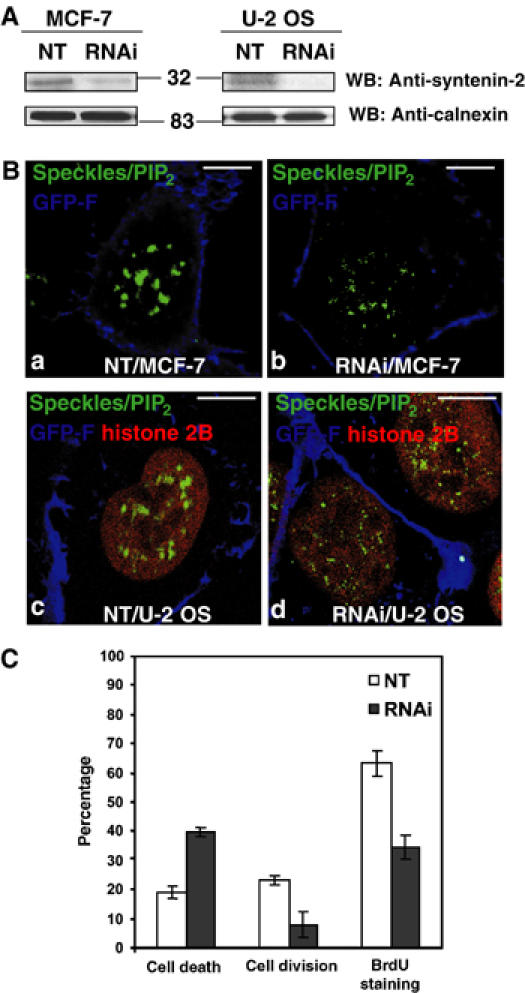
Suppression of syntenin-2 affects the nuclear PIP2 staining pattern, cell viability and cell division. (A) Western blot analysis of total cell extracts from MCF-7 cells (left panels) or U-2 OS cells (right panels), treated with an NT or an siRNA targeting syntenin-2 (RNAi). Note that endogenous levels of syntenin-2 decrease in RNAi-treated cells (upper panels) while calnexin signals are not affected (lower panels). Numbers indicate molecular weight markers in kDa. (B) Confocal micrographs of MCF-7 cells (a, b) and U-2 OS cells stably expressing RFP-histone 2B (c, d), transfected with an NT (a, c) or an siRNA targeting syntenin-2 (b, d) together with an expression vector for farnesylated eGFP (GFP-F) as a marker of transfected cells (blue signal at the plasma membrane). The nuclear speckles/PIP2 pattern was visualized using 2C11 antibody (green). RFP-histone 2B in U-2 OS is in red. Size bars are 10 μm. (C) Cell death and cell division in U-2 OS cells stably expressing RFP-histone 2B, treated with an NT or an siRNA for syntenin-2 (RNAi), were quantified in three independent experiments, by multipositioning time-lapse video microscopy, looking at the fate of a minimum of 50 transfected cells per condition in each experiment. Incorporation of BrdU by U-2 OS cells was quantified in three independent experiments, by wide-field fluorescence microscopy, on 200 cells per condition in each experiment. Bars indicate standard deviations.