
Figure 2.
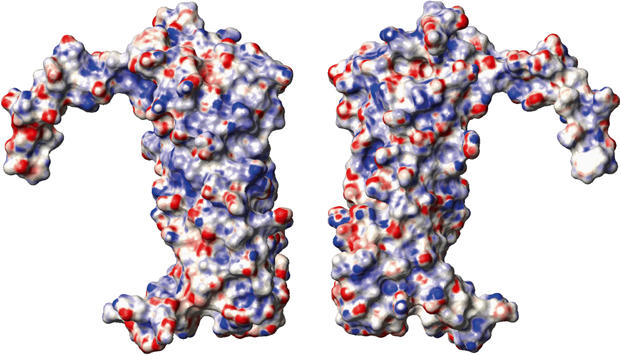
Space-filled views of the surface of the CFP-10·ESAT-6 complex based on the converged structure closest fit to the mean. The right-hand view depicts the complex in the same orientation as in Figure 1, while the left-hand view is rotated by 180o about the vertical axis to show the opposite face. The surface is coloured according to electrostatic potential, with areas of significant negative charge in red, significant positive charge in blue and neutral as white. The electrostatic potential was calculated using MOLMOL (Koradi et al, 1996), with the threshold for depicting significant areas of charge chosen to obtain a neutral representation for the fully exposed aromatic ring of Phe100 in CFP-10.