
Figure 1.
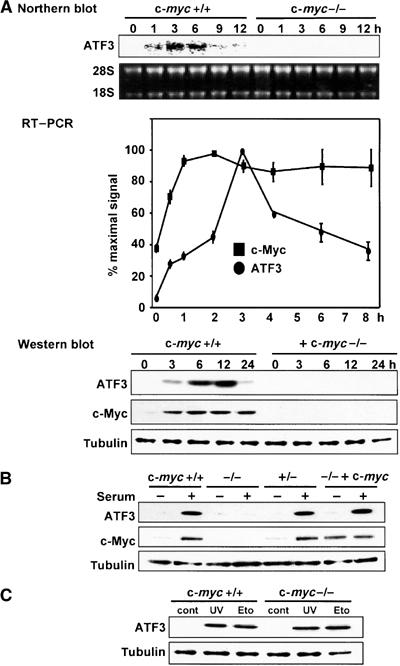
Serum induction of ATF3 in c-myc-deficient cells. (A) Upper panel: Northern blot analysis of ATF3 mRNA in serum-stimulated wild-type TGR1 and c-myc-deficient HO15.19 cells. Middle panel: RT–PCR analysis of ATF3 and c-Myc mRNA in wild-type cells after serum stimulation. Results are means with s.d. of triplicate experiments and shown as percent of the maximal amount of each transcript. Lower panel: Western blot analysis of ATF3 and c-Myc in wild-type and c-myc-deficient cells after serum stimulation. Immunoblot of tubulin is shown as a control of protein loading. (B) Western blot analysis of ATF3 and c-Myc in heterozygous c-myc-knockout +/− cells and homozygous c-myc-knockout −/− cells reconstituted with a c-myc transgene after serum stimulation. Cell extracts were prepared 12 h after serum treatment. (C) Stress-induced expression of ATF3 in wild-type and c-myc-deficient cells in response to UV (40 J/m2) or 20 μM etoposide (Eto). Control (cont) represents untreated cells.