

SUMMARY
Progranulin (PGRN) deficiency is linked to neurodegenerative diseases, including frontotemporal dementia (FTD), Alzheimer’s disease, and Parkinson’s disease. Proper PGRN levels are critical for brain health; however, the function of PGRN is unclear. PGRN is composed of 7.5 repeat domains, called granulins, and processed into granulins inside the lysosome. PGRN is beneficial for neuronal health, but the role of individual granulins is controversial and unclear. We find that the expression of single granulins broadly rescues disease pathology in Grn−/− mice. Adeno-associated virus (AAV)-mediated expression of human granulin-2/F, granulin-4/A, or PGRN in Grn−/− mouse brain ameliorates dysregulated lysosomal proteins and lipids, microgliosis, and lipofuscinosis. Mechanistically, granulins localize to lysosomes in Grn−/− mouse brains or fibroblasts. These data support the hypothesis that PGRN is a precursor to granulins, which share a beneficial function inside the lysosome to maintain lipid and protein homeostasis to prevent neurodegeneration. Thus, granulins are potential therapeutics to treat FTD-GRN and related diseases.
In brief
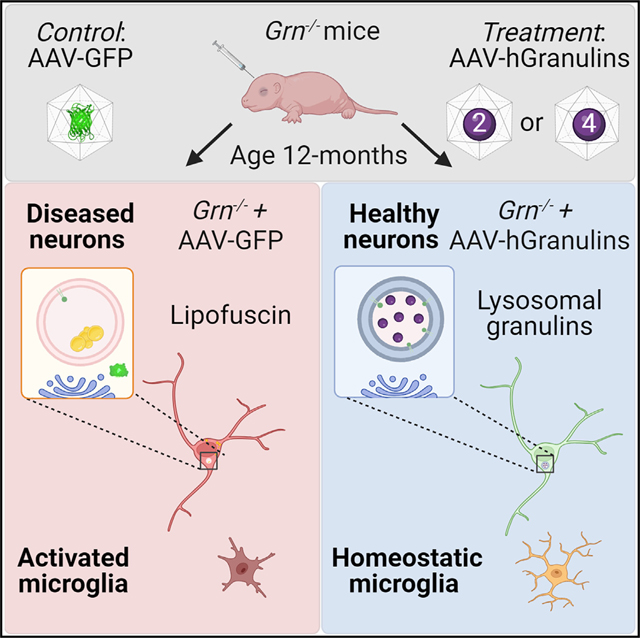
Root et al. report that expression of individual granulins, 6 kDa subunits of progranulin (88 kDa), is sufficient to prevent disease-associated phenotypes in aged Grn−/− mice. Granulins ameliorated lysosomal dysfunction, microglial activation, lipid dysregulation, and lipofuscin accumulation in Grn−/− mouse brains, suggesting that granulins are the functional components of progranulin.
Graphical Abstract
INTRODUCTION
The granulin (GRN) gene encodes progranulin (PGRN), an evolutionarily conserved protein that is critical for neuronal survival.1 Haploinsufficiency of PGRN due to GRN mutations causes frontotemporal dementia (FTD), a common neurodegenerative disease in people under 60.2–4 Complete PGRN deficiency causes neuronal ceroid lipofuscinosis (NCL), a neurodegenerative lysosomal storage disorder (LSD).5,6 Moreover, genetic variants in GRN decrease PGRN and increase the risk of developing Alzheimer’s disease (AD), Parkinson’s disease (PD), or limbic-predominant age-related TDP-43 encephalopathy (LATE).7–10 Multiple therapies are being pursued to treat neurodegenerative diseases associated with decreased PGRN.11,12 Despite these advances, the function of PGRN is still unresolved and is a roadblock for drug development.
PGRN is a ~80 kDa glycoprotein that is ubiquitously expressed and enriched in microglia and neurons in the brain.13–15 Mammalian PGRN is composed of 7.5 tandem repeat proteins, called granulins (GRNs), that are stabilized by disulfide bonds (Figure 1A).16 Within PGRN, each GRN is joined together by short linkers, which can be cleaved by proteases to release mature GRNs.14,17,18 We refer to each GRN numbered 1 through 7 based on the UniProtKB database:P28799 rather than the colloquial A through G nomenclature. The relationship between the activity of PGRN and individual GRNs is debated and still unclear. Multiple functions have been ascribed to PGRN, including cell growth, neurotrophic signaling, and anti-inflammatory activity. The pleiotropic activity of PGRN may occur through binding signaling receptors4,19; however, some PGRN-receptor interactions have not been replicated,20–22 raising the possibility of other mechanisms of action. Furthermore, the function of individual GRNs, also called epithelins, is controversial and unresolved. Depending on the model, GRNs have been reported to be neurotrophic,23 pro-inflammatory,17 neurotoxic,24 or to impair lysosome function.25
Figure 1. i.c.v. injection of rAAV at birth leads to expression of hGRN2, hGRN4, hPGRN, and GFP throughout the Grn−/− mouse brain.
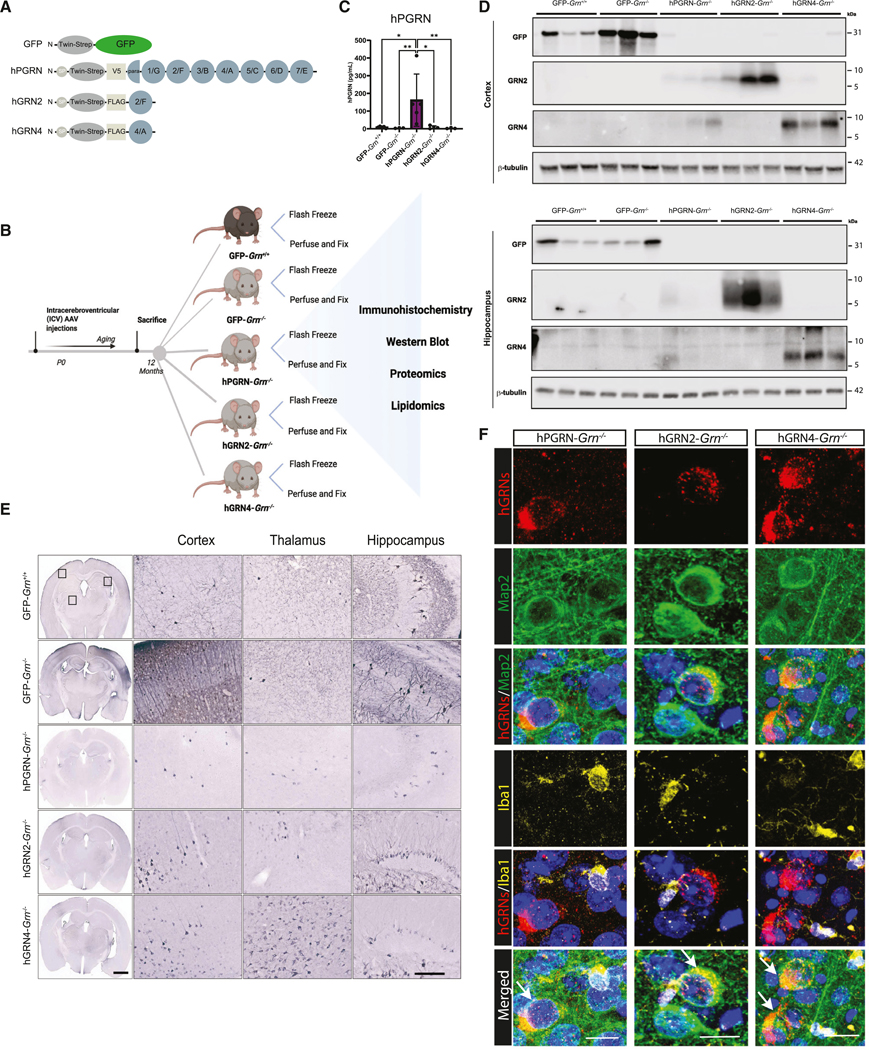
(A) Constructs including coding region, domains, and epitope tags that were packaged into rAAV2/1 (Twin-Strep tag; V5 tag; FLAG tag; SP, signal peptide; paragranulin; granulin-1 [GRN1; G]; GRN2 [F]; GRN3 [B]; GRN4 [A]; GRN5 [C]; GRN6 [D]; GRN7 [E]).
(B) Experimental workflow includes intracerebroventricular (i.c.v.) injection of rAAV, mouse aging, sample collection, and sample analysis.
(C) ELISA quantification of hPGRN in cortical tissue from rAAV-injected mice as mean ± SD. One-way ANOVA with Tukey’s post hoc correction. n = 6–7 mice/group. *p < 0.05 and **p < 0.01.
(D) Immunoblot of cortical and hippocampal lysates verifying expression of GFP, hGRN2, and hGRN4 (β-tubulin loading control).
(E) IHC images of Twin-Strep to visualize expression of GFP, hPGRN, hGRN2, and hGRN4 in coronal section plus magnified images of the cortex, hippocampus, and thalamus. Scale bars: 2 μm (full section) and 200 μm (magnified boxes).
(F) Immunofluorescence (IF) images co-staining for hPGRN, hGRN2, and hGRN4 and antibody markers for neurons (Map2) and microglia (Iba1) in the cortex of an hPGRN, hGRN2-Grn−/−, and hGRN4-Grn−/− mouse. Scale bar: 10 μm.
The discovery by our lab, and others, that GRNs are made constitutively inside lysosomes led us to reevaluate the functional relationship between PGRN and GRNs.26–28 Because the complete loss of GRNs in humans and mice causes an LSD, with more severe neurodegeneration than PGRN haploinsufficiency, we reasoned that GRNs have an intra-lysosomal function. This idea is supported by the function of other lysosomal proteins like saposins, which are generated from prosaposin.29 Here, we test the hypothesis that PGRN is a precursor to GRNs, which are the functional units that mediate lysosomal homeostasis and are neuroprotective. We used recombinant adeno-associated virus (rAAV2/1) to assess whether expression of individual GRNs in the brain of PGRN-deficient mice can correct disease-associated phenotypes. We find that neuronal expression of a single GRN ameliorates a range of phenotypes, including lysosomal dysfunction, microgliosis, lipid abnormalities, and lipofuscin accumulation, to the same extent as full-length PGRN. These findings provide compelling evidence that GRNs are the bioactive subunits of PGRN and indicate that potential therapeutic approaches for FTD-GRN should consider their effect on GRN levels. Furthermore, this work supports the potential use of GRNs for the treatment of diseases associated with PGRN deficiency.
RESULTS
Injection of rAAV at birth leads to widespread expression of GRNs, PGRN, and GFP throughout the mouse brain
We utilized Grn−/− mice to test the hypothesis that GRNs are functionally active and neuroprotective. These mice lack PGRN and develop neuropathology similar to NCL and FTD-GRN, including neuroinflammation and microgliosis,30–32 alterations in lysosomal gene expression,33,34 and accumulation of lipofuscin.35,36 In these experiments, we compared human GRN2 (hGRN2) and hGRN4, as previous studies suggested they have opposing functional activity.37 Furthermore, hGRN2 (also known as GRN F) and hGRN4 (also known as GRN A) share 50% identity at the amino acid level, and we reasoned that this would be sufficient to reveal differences in bioactivity if present (Figures S1A and S1B). Human PGRN (hPGRN) and GFP served as positive and negative controls, respectively. The endogenous N-terminal signal peptide (SP) from hPGRN was engineered to precede hGRN2 and hGRN4 expression constructs to ensure trafficking through the secretory pathway, which is important for the folding and sorting of lysosomal proteins.38 This sequence was followed by epitope tags (Twin-Strep tag and V5 or FLAG) preceding the coding region to facilitate detection (Figure 1A). We verified our constructs by transfecting HeLa GRN−/− cells and collected media and cell lysates (Figure S2). As expected, hPGRN is secreted into the media and accumulates as an ~80 kDa band (Figures S2A and S2B). hGRN2 and hGRN4 are secreted into the media as ~15 kDa proteins that are immunoreactive for Twin-Strep tag and hGRN2 and hGRN4 antibodies, respectively. In cell lysates, we observe full-length, unprocessed hGRN2 and hGRN4 (~15 kDa), as well as bands for cleaved hGRN2 (~6 kDa) and hGRN4 (~8 kDa) (Figure S2A). These bands retain immunoreactivity for anti-GRN antibodies but lose reactivity for the Twin-Strep tag, demonstrating that the tag has been cleaved. Moreover, the mature hGRN2 and hGRN4 bands migrate at the same molecular weight as endogenous GRNs in HeLa wild-type cells or HeLa GRN−/− cells following re-expression of hPGRN. These data demonstrate that the hPGRN, hGRN2, and hGRN4 constructs are properly secreted as well as trafficked to the lysosome and cleaved into GRNs.26
Following in vitro validation, we generated hybrid rAAV2/1 encoding hGRN2, hGRN4, hPGRN, and GFP and performed bilateral intracerebroventricular (i.c.v.) injections of rAAV2/1 vectors into newly born (postnatal day P0) litters of Grn−/− and Grn+/+ mice (Figure 1B; see Table S1). This experimental paradigm, termed somatic brain transgenesis (SBT), preferentially transduces neurons when using AAV vectors packaged in the capsid 1 serotype and leads to widespread and long-term expression of genes of interest in the mouse brain.39–41 All mice were aged to 12 months old, a time when substantial neuropathological changes occur in Grn−/− mice. Next, we characterized the distribution and expression of each rAAV2/1 vector throughout the brain of injected Grn−/− and Grn+/+ mice. To confirm the specific identity of expressed proteins, we performed immunoblotting of lysates from flash-frozen cortical and hippocampal brain tissue. Using specific GRN antibodies produced in our lab, we confirmed the expression of hGRN2 in hGRN2-Grn−/− mice, hGRN4 in hGRN4-Grn−/− mice, and GFP in GFP-Grn−/− and Grn+/+ mice in both the hippocampus and cortex (Figure 1D). These antibodies recognize full-length hPGRN and GRNs in HeLa cell lysates and media. The selectivity and specificity of anti-GRN antibodies were confirmed using GRN−/− cells (Figures S2A–S2C). Importantly, using these antibodies, we detect production of hGRN2 and hGRN4 in cortex and hippocampal lysates of AAV-hPGRN-injected Grn−/− mice (Figures S3A and S3B). Full-length hPGRN was difficult to detect in mouse brain lysates by immunoblot, likely due to its rapid cleavage into GRNs.26 Instead, we used a commercial ELISA to confirm the expression of hPGRN in hPGRN-Grn−/− mice (Figure 1C). Immunostaining of serial coronal sections for the Twin-Strep tag, which is shared across expression constructs, visualized and verified widespread expression of all encoded proteins in the hippocampus, thalamus, and cortex across injected mice (Figure 1E). Then, we assessed which cell types in the brain expressed GRNs following rAAV2/1 transduction. We performed immunofluorescent co-labeling of hPGRN, hGRN2, or hGRN4 with the neuronal marker Map2, the microglial marker Iba1 (Figure 1F), or the astrocytic marker Gfap (Figure S4A) in hPGRN-Grn−/−, hGRN2-Grn−/−, and hGRN4-Grn−/− mice. We find that the vast majority of signals for hPGRN, hGRN2, or hGRN4 are found in cells expressing the neuronal marker Map2. We observed rare co-localization of hPGRN and hGRN4 in Iba1-positive cells (Figure S4B). In contrast, we did not observe any co-localization with Gfap-positive cells (Figure S4A). Thus, neonatal i.c.v. injection of rAAV2/1 produced robust and stable neuronal expression of transgenes in mouse brains over the 12 month period of our experiments.
Proteome-wide dysregulation in the thalamus of Grn−/− mice is ameliorated by expression of GRNs
The thalamus is a major site of pathologic changes in the brains of Grn−/− mice42 and patients with FTD-GRN43,44; however, the underlying pathogenic mechanisms are still poorly defined. To provide deeper insight into dysfunction of the thalamus caused by PGRN deficiency, we performed quantitative proteomics on the thalamus from 12-month-old Grn−/− mice injected with rAAV2/1 encoding hGRN2, hGRN4, hPGRN, or GFP and Grn+/+ mice injected with rAAV2/1 encoding GFP (Figure 1B). Thalamic lysates were labeled with isobaric tandem mass tags (TMTs), followed by offline electrostatic repulsion-hydrophilic interaction chromatography (ERLIC) fractionation prior to liquid chromatography-tandem mass spectrometry (LC-MS/MS), resulting in the identification and quantification of 9,255 proteins across all samples (Figure S5A; see Table S2).
We next compared the GFP-Grn+/+ and GFP-Grn−/− thalamic proteomes to identify differentially expressed proteins. In GFP-Grn−/− mice, we identified 131 proteins that increased and 9 proteins that decreased in abundance in the thalamus compared to GFP-Grn+/+ mice (R1.2-fold change; false discovery rate [FDR] q < 0.05; Figure 2A; see Table S2). Gene Ontology (GO) analysis of the top 100 differentially expressed proteins using Metascape found a significant enrichment (−log10(p) > 10) of proteins involved in lysosome function (KEGG mmu04142), glycosphingolipid metabolism (R-MMU-1660662), and protein catabolic processes in the vacuole (GO: 0007039) (Figure 2B). Some of the most significantly dysregulated proteins in Grn−/− mice included lysosomal hydrolases (ARSA, GNS, HEXA, HEXB, MANBA) and proteases (CTSD, DPP7, LGMN, TPP1). Additionally, modules related to inflammatory processes were significantly enriched (−log10(p) > 5), including major histocompatibility complex (MHC) class II antigen presentation (R-MMU-2132295) and regulation of the complement cascade (R-MMU-977606), which includes C1Qa, C1Qb, C1Qc, and C1Qb.
Figure 2. GRN2 and GRN4 prevent widespread protein dysregulation caused by PGRN deficiency in the thalamus of Grn−/− mice.

(A) Volcano plot of upregulated (yellow) and downregulated proteins (blue) in the thalamus of GFP-Grn−/− vs. GFP-Grn+/+ mice (fold change [FC] > 1.2, p < 0.05).
(B) Bar graph of the most significantly enriched Gene Ontology (GO) terms describing the differentially expressed proteins in (A) (GFP-Grn−/− mice vs. GFP-Grn+/+ mice; FC = 1.2 and adjusted p value = 0.05). Displaying all significant changed modules (p < 0.05).
(C) Plot of PCs (PC1 vs. PC2) for GFP-Grn+/+ mice (blue), GFP-Grn−/− mice (gray), hPGRN-Grn−/− mice (purple), hGRN2-Grn−/− mice (green), and hGRN4-GFP-Grn−/− mice (yellow). Ellipses: 95% confidence interval.
(D) Heatmap of top 140 proteins (rows) differentially expressed between GFP-Grn−/− and GFP-Grn+/+ and treatment groups (columns). Quantification of individual proteins shown (log2Z score transformed). Individual mouse numbers are below the column.
(E) Bar plots comparing correction of elevated levels of LGALS3, CD68, GFAP, GPNMB, HEXB, LYZ2, MPEG1, SERPINA3N, and TPP1 in Grn−/− mice injected with GFP, hGRN2, hGRN4, or hPGRN. Mean (protein abundance) ± SD. One-way ANOVA with Tukey’s post hoc. n = 5–7 mice/group. *p < 0.05, **p < 0.01, ***p < 0.001, and ****p < 0.0001.
(F) Correlation of hGRN2 (green) and hGRN4 (yellow) expression with galectin-3 (R = 0.78, p = 0.0011).
(G) Correlation of hGRN2 (green) and hGRN4 (yellow) expression with P2RY12 (R = 0.77, p = 0.0014).
Individual GRNs rescue dysregulated proteins in the thalamus of Grn−/− mice
After characterizing differences between the proteomes of Grn−/− and Grn+/+ mice, we asked if expression of GRNs or hPGRN ameliorated the changes observed in Grn−/− thalamus. To visualize changes more easily between experimental groups, we used principal-component analysis (PCA) to reduce the complexity and dimensionality of the proteomic datasets. Using PCA, we extracted 10 components from the combined AAV-injected Grn−/− and Grn+/+ proteomics dataset, which together account for 93% of variance in the samples (Figure S5B). Comparing principal components 1 and 2 (PC1 and PC2) revealed a clear separation of GFP-Grn+/+ (blue) and GFP-Grn−/− (gray) samples, with no overlap between these two groups (Figure 2C). Samples from hGRN2-Grn−/− (green), hGRN4-Grn−/− (yellow), and hPGRN-Grn−/− (purple) mice did overlap and cluster closer together with GFP-Grn+/+ mice, revealing a shift toward wild-type mice and away from Grn−/− mice, suggesting a correction of altered protein levels.
To evaluate the rescue of disease-linked phenotypes in more detail, we created a heatmap containing the 140 differentially expressed proteins from the GFP-Grn−/− and GFP-Grn+/+ proteomics comparison and included hGRN2-Grn−/−, hGRN4-Grn−/−, and hPGRN-Grn−/− samples (Figure 2D). Visually, the groups of Grn−/− mice treated with hGRN2, hGRN4, and PGRN are more like GFP-Grn+/+ than GFP-Grn−/− mice. To provide a quantitative measurement of rescue, we compared the expression levels of the most upregulated (2-fold; p < 0.001) proteins (LGALS3, CD68, GFAP, GPNMB, HEXB, LYZ2, MPEG1, SERPINA3N, and TPP1) in the GFP-Grn−/− proteome across rAAV treatment groups. rAAV-mediated expression of hGRN2, hGRN4, or hPGRN in Grn−/− mice significantly decreased expression levels back toward wild-type levels of all nine proteins, indicating the correction of abnormally elevated proteins (Figure 2E). This analysis provides compelling evidence that expression of an individual GRN in the Grn−/− mouse brain can functionally substitute the full-length PGRN protein.
Of note, in some cases, elevated proteins in Grn−/− mouse brains were not corrected as efficiently in hGRN2-injected groups compared to hGRN4- and hPGRN-injected groups (e.g., TPP1; Figure 2E). One explanation for this result is that GRNs are expressed at different levels between groups. To investigate this, we compared expression levels of hGRN2 and hGRN4 in the Grn−/− thalamic proteomics dataset by examining a tryptic fragment of the Twin-Strep-FLAG tag shared between both proteins, revealing that hGRN4 expression was ~2.5-fold higher than that of hGRN2 (Figure S5C). We then asked whether the expression level of GRN2 or GRN4 correlated with phenotypic rescue. Notably, the abundance of hGRN2 and hGRN4 correlated with galectin-3 (R = −0.78; p = 0.0011) (Figure 2F) and P2RY12 (R = 0.77 p = 0.0014) levels (Figure 2G) in the Grn−/− thalamic proteome. Further, in individual mice, higher levels of either hGRN2 or hGRN4 correlated with the correction of altered protein levels, suggesting that the apparent decreased efficacy of hGRN2 is due to lower expression levels, not function. Taken together, proteomic analysis of the thalamus of Grn−/− mouse reveals that rAAV-mediated expression of a single GRN ameliorates widespread protein dysregulation caused by loss of PGRN.
Markers of lysosomal dysfunction are rescued by GRN expression across brain regions
To confirm and extend the proteomics data, we analyzed tissue from additional, independent cohorts of rAAV2/1-injected Grn+/+ and Grn−/− mice that were processed for immunohistochemistry (IHC), immunoblot (western blot), or lipidomics (Figure 1B). In human patients, the complete loss of PGRN leads to a lysosomal storage disease called NCL. Characteristics of NCL have been identified in FTD-GRN mutation carriers, and many of these are recapitulated in Grn−/− mice. These include signs of lysosomal dysfunction like the upregulation of lysosomal proteins, altered lysosomal enzyme activity, and disruption of macromolecule catabolism.45 Considering this, we expected that lysosomal dysfunction would be a major phenotype detected by our proteomic analysis, and “lysosome” was the most significant GO term in the GFP-Grn−/− thalamic proteome. To understand which proteins from our dataset contributed to this GO term, we constructed a heatmap with all proteins that were assigned to this module (Figure 3A). To further validate these finding, we focused on two markers of lysosomal dysfunction: cathepsin Z (CTSZ)42 (Figures 3B and 3D–3H) and galectin-3 (LGALS3) (Figure 3C and 3I–3M). Cathepsin Z is a lysosomal cysteine protease that is upregulated in LSDs and neurodegenerative diseases.46–48 We performed IHC to examine the levels of cathepsin Z in hippocampal, thalamic, and cortical tissues of Grn−/− mice injected with rAAV2/1 expressing GFP, hGRN2, hGRN4, and hPGRN (n = 5; one section/mouse) (Figure 3B). Quantification of IHC staining in the cortex, thalamus, and hippocampus was performed using CellProfiler (Figure S6) and revealed a significant increase in cathepsin Z signal in GFP-Grn−/− mice across all regions examined (Figure 3D). Expression of hGRN2, hGRN4, and hPGRN corrected elevated levels of cathepsin Z in the cortex (Figure 3D). In the thalamus and hippocampus, only hGRN4 expression led to a statistically significant decrease in the level of cathepsin Z in these samples (Figure 3D).
Figure 3. GRNs ameliorate dysregulated lysosomal proteins, including cathepsin Z and galectin-3, in the brains of Grn−/− mice.

(A) Heatmap of differentially expressed (log2Z score transformed) lysosomal proteins (GO module) in GFP-Grn−/− and GFP-Grn+/+ mice. 42 proteins are included (rows) across mice from all treatment groups (columns).
(B and C) Representative (B) cathepsin Z and (C) galectin-3 IHC of coronal sections from rAAV-injected groups (GFP, hPGRN, hGRN2, hGRN4). Scale bar: 2 mm.
(D) Quantification of cathepsin Z IHC signal in cortex, hippocampus, and thalamus.
(E) Immunoblot for cathepsin Z in cortical, hippocampal, and thalamic brain lysates from all injection groups.
(F–H) Quantification of (F) cortical, (G) thalamic, and (H) hippocampal immunoblot of cathepsin Z normalized to H3.
(I) Quantification of galectin-3 IHC signal in cortex, hippocampus, and thalamus.
(J) Immunoblot for galectin-3 in cortical, hippocampal, and thalamic brain lysates from all injection groups.
(K–M) Quantification of (K) cortical, (L) thalamic, and (M) hippocampal galectin-3 immunoblot normalized to H3.
Data are presented as means ± SD. n = 5 mice/group. p values were calculated by one-way or two-way (D and I) ANOVA with Tukey’s post hoc analysis. *p < 0.05, **p < 0.01, ***p < 0.001, and ****p < 0.0001.
We then performed immunoblotting on separate cohorts of mice to provide a complementary measurement of cathepsin Z in hippocampal, thalamic, and cortical tissue samples (Figure 3E). Cathepsin Z was increased in the GFP-Grn−/− mouse cortex, hippocampus, and thalamus compared to wild-type counterparts (Figures 3E–3H). In agreement with the proteomics analyses, cathepsin Z levels were normalized by expression of hGRN2, hGRN4, and hPGRN in the Grn−/− thalamus (Figures 3E and 3G). Cathepsin Z levels were also decreased in the cortex and hippocampus by hGRN4 and hPGRN, while hGRN2 treatment trended lower but did not reach significance (Figures 3F and 3H).
We also assessed levels of galectin-3 (LGALS3), a beta-galactoside binding lectin that is recruited to damaged lysosomes49 to facilitate lysosomal repair.50 Immunostaining of 12-month-old GFP-Grn+/+, GFP-Grn−/−, hPGRN-Grn−/−, hGRN2-Grn−/−, and hGRN4-Grn−/− mouse coronal sections demonstrated that galectin-3 was increased in the thalamus and cortex of GFP-Grn−/− mice (Figure 3C). Similarly to cathepsin Z, expression of hGRN2, hGRN4, and hPGRN corrected elevated galectin-3 in the thalamus compared to GFP-Grn+/+ mice (Figure 3I).
These results were further validated using immunoblot to measure galectin-3 levels in lysates of the cortex, thalamus, and hippocampus tissue from a separate cohort of rAAV2/1-injected mice (n = 5) (Figure 3J). We confirmed that galectin-3 was upregulated in cortical, thalamic, and hippocampus tissue lysates of GFP-Grn−/− mice compared to GFP-Grn+/+ mice (Figures 3J–3M). Importantly, rAAV-mediated expression of hGRN2, hGRN4, and hPGRN reduced elevated galectin-3 expression in cortical and thalamic tissues (Figures 3K and 3L). In hippocampal samples, hGRN4 and hPGRN significantly reduced elevated galectin-3 levels in Grn−/− mice (Figure 3M). In summary, we find that IHC and immunoblot analysis confirm and extend our proteomics data, demonstrating that expression of hGRN2 or hGRN4 ameliorates elevated cathepsin Z and galectin-3 levels throughout multiple brain regions of Grn−/− mice. These data provide more evidence that a single GRN can functionally substitute the activity of full-length PGRN.
Microglial activation and inflammatory markers are reduced by hGRNs
While neurons express PGRN, the GRN gene is also highly expressed in microglia.51 Loss of PGRN in Grn−/− mice causes inflammation, astrocytosis, and microgliosis, which has been linked to synaptic loss and disease progression.32,52 In the Grn−/− thalamic proteome, we find that many of the most dysregulated proteins are expressed by microglia, including GPNMB, CD68, and P2RY12 (Figure 2A). To examine this in more detail, we constructed a heatmap containing markers of microglial homeostasis, function, and activation in the proteome of Grn+/+ and Grn−/− injected cohorts (Figure 4A).53,54 We found multiple markers of microglial activation, including CD45 and CD68, were upregulated in the GFP-Grn−/− thalamus (Figures 4B and 4D). In addition, P2RY12, a marker of microglia homeostasis was downregulated in GFP-Grn−/− mice (Figure 4C). Based on proteomics analyses, the elevation of CD45 was reduced by the expression of hGRN2, hGRN4, and hPGRN, while depressed P2RY12 levels were increased by hGRN4 and hPGRN (Figures 4B and 4C).
Figure 4. GRNs ameliorate markers of microglial activation in Grn−/− mouse brains.

(A) Heatmap of differentially expressed (log2Z score-transformed) proteins associated with microglial activation and dysfunction (rows) in all treatment groups in GFP-Grn−/− compared to GFP-Grn+/+ (columns).
(B) Abundance of CD45 (PTPRC) across all treatment groups.
(C) Abundance of P2RY12 across all treatment groups.
(D) Representative CD68 IHC of 12-month-old mouse coronal brain sections across all treatment groups. Scale bar: 2 mm.
(E) Quantification of CD68 IHC signal of cortex, hippocampus, and thalamus.
(F) Immunoblot of CD68 in cortical and thalamic brain tissue from all injection groups.
(G) Quantification of immunoblot of cortical CD68 signal normalized to H3.
(H) Quantification of immunoblot of thalamic CD68 signal normalized to H3.
(I) Quantification of GPNMB levels in thalamus using ELISA.
Data are presented as means ± SD. p values were calculated by one-way or two-way (E) ANOVA with Tukey’s post hoc analysis. *p < 0.05, **p < 0.01, ***p < 0.001, and ****p < 0.0001.
To expand our investigation to additional brain regions and validate proteomics, we examined levels of CD68, a type I transmembrane glycoprotein commonly used as a microglial activation marker55 and recently identified as a binding partner of PGRN,56 using IHC and immunoblotting in additional cohorts of mice. Immunohistochemical staining for CD68 revealed robust and significant increases in CD68 in the cortex, hippocampus, and thalamus of GFP-Grn−/− mice (Figures 4D and 4E). Expression of hGRN4 in Grn−/− mice lowered CD68 reactivity in all regions, while expression of hGRN2 significantly reduced levels in the thalamus and cortex but not the hippocampus (Figure 4E). Immunoblot of tissue lysates verified that CD68 levels were increased in the cortex and thalamus of GFP-Grn−/− mice compared to GFP-Grn+/+ mice but below detection in the hippocampus (Figure 4F). Similar to immunohistochemical analysis, rAAV expression of both hGRN2 and hGRN4 corrected elevated CD68 levels relative to GFP-Grn−/− in the cortex (Figure 4G) and thalamus (Figure 4H).
Finally, we asked if expression of GRNs corrected levels of GPNMB, the most elevated protein in the Grn−/− brain thalamic proteome (Figure 2A), which was decreased by the expression of hGRN2 and hGRN4 in the thalamic proteomics (Figure 2E). GPNMB is a type 1 transmembrane glycoprotein that we discovered is highly upregulated by PGRN-deficient microglia.42 The function of GPNMB in microglia is unknown; however, GPNMB upregulation has been observed in activated damage-associated microglia57 and is functionally linked to lysosomal stress and lipid accumulation.58,59 We could not detect GPNMB via immunoblot at this age; therefore, we quantified murine GPNMB levels in thalamic tissue lysates using a validated ELISA.42 Using this approach, we found that expression of either hGRN2 or hGRN4 corrected elevated GPNMB levels to the same extent as hPGRN in Grn−/− mice (Figure 4I). In sum, proteomics and multiple orthogonal biochemical measurements in separate cohorts of mice reveal that expression of hGRN2, hGRN4, and hPGRN, especially in the thalamus, decrease microglial activation in Grn−/− mice.
Lysosomal lipid dysregulation is rescued by a single GRN
The role of GRNs in the lysosome is not fully understood. Previous studies identified lipid dysregulation in PGRN-deficient animal models and FTD-GRN patient samples, suggesting that lysosomal metabolism of lipids is impaired.12,60–62 In particular, Grn−/− mice display decreased levels of bis(monoacylglycerol) phosphate (BMP), an atypical endo-lysosomal lipid, and increased levels of glucosylsphingosine (GlcSph), a substrate of glucocerebrosidase (GCase), which can be corrected by the administration of exogenous full-length hPGRN.63 Additionally, ganglioside levels increase in brain tissues from Grn−/− mice and patients with FTD-GRN,64 which may accumulate as secondary storage material, a phenomenon observed in many LSDs.65,66 To validate these observations and determine whether the expression of a single GRN or full-length hPGRN can correct them, we performed lipidomics and metabolomics analyses on the cortex of GFP-Grn+/+, GFP-Grn−/−, hPGRN-Grn−/−, hGRN2-Grn−/−, and hGrn4-Grn−/− mice (see Tables S3, S4, S5, S6, and S7).
We saw a decrease in the levels of BMP species and an increase in the levels of GlcSph species in GFP-Grn−/− mice compared with GFP-Grn+/+ mice (Figure 5A). In addition, we observed smaller but significant increases of several gangliosides in the GFP-Grn−/− mouse brain (Figure 5A), similar to previous reports.64 AAV-mediated expression of hGRN4 and hPGRN, but not hGRN2, in the Grn−/− mouse brain significantly increased all measured BMP species back toward levels found in GFP-Grn+/+ mice (Figure 5B). Similarly, we found that both hGRN4 and hPGRN corrected the elevation of GlcSph (Figure 5C) and gangliosides (Figure 5D) in the GFP-Grn−/− mouse brain. hGRN2 showed a slight but non-significant reduction in GlcSph and ganglioside levels as well. It is unclear why hGRN2 did not rescue BMP and gangliosides to the same extent as hGRN4 and hPGRN. This could be due to lower expression of hGRN2 (Figure S5C) or that different GRNs may have specific functions in lysosomal lipid metabolism. Overall, these results show that a single GRN can correct multiple lysosomal lipids that are dysregulated in the Grn−/− mouse brain to the same extent as full-length hPGRN. Further research is needed to understand the specific functions of different GRNs on lysosomal lipid metabolism.
Figure 5. GRNs correct dysregulated lipids and prevent pathological accumulation of autofluorescent lipofuscin in Grn−/− mouse brains.

(A) Volcano plot of lipids or metabolites upregulated (red) or downregulated (blue) in GFP-Grn−/− mouse brain cortex compared to GFP-Grn+/+.
(B) Quantification of differentially abundant BMP species.
(C) Quantification of differentially abundant glycosphingosine species.
(D) Quantification of differentially abundant gangliosides species.
(E) Representative lipofuscin autofluorescence from hippocampal and thalamic regions of coronal sections from all injection groups presented in grayscale.
(F) Quantification of fluorescent lipofuscin signal from cortex, hippocampus, and thalamus across all injected groups.
Data are presented as mean ± SD. n = 5–7 mice/group. p values were determined by one-way or two-way (F) ANOVA with Tukey’s post hoc analysis. *p < 0.05, **p < 0.01, ***p < 0.001, and ****p < 0.0001.
Lipofuscin accumulation in Grn−/− brains is alleviated by expression of hGRNs
Autofluorescent lipofuscin is a marker of lysosome dysfunction and a neuropathologic feature of human FTD-GRN and Grn−/− mouse brain tissue.35,67,68 We set out to evaluate the extent and anatomical location of lipofuscin neuropathology in our rAAV-injected Grn−/− mouse brain cohorts. We imaged whole coronal sections using Cy3 excitation and emission filters to capture autofluorescence in GFP-Grn+/+, GFP-Grn−/−, hPGRN-Grn−/−, hGRN2-Grn−/−, and hGRN4-Grn−/− mice. Fluorescent signal in the cortex, hippocampus, and thalamic regions of all AAV-injected mice was then quantified using CellProfiler (Figure 5E). We observed a robust increase in lipofuscin in GFP-Grn−/− animals compared with GFP-Grn+/+ animals in the thalamus and hippocampal regions but not the cortex (Figures 5E and 5F). Next, we found that the expression of hGRN2, hGRN4, and hPGRN decreased lipofuscin accumulation in the thalamus and hippocampus compared to GFP-Grn−/− mice (Figures 5E and 5F). These data agree with our proteomic and lipidomic analyses and provide additional evidence that individual GRNs can ameliorate widespread lysosomal dysregulation in Grn−/− mice, including the accumulation of lipofuscin, which has been linked to neurotoxicity and neurodegeneration in LSDs.35
GRNs localize to the lysosome in cells and mouse brain
We show that AAV-mediated delivery of a single GRN corrects a broad spectrum of pathological changes in the Grn−/− mouse brain. Our working hypothesis posits that the localization of GRNs to the lysosome is necessary to mediate beneficial activity and correct pathological phenotypes. To provide insight into this potential mechanism, we asked whether GRNs localized to the lysosome in vivo or in vitro following viral transduction.
We performed fluorescent IHC to determine if GRNs colocalize with cathepsin D (CTSD), a luminal lysosomal hydrolase, in Grn−/− mouse brains injected with AAV encoding hPGRN, hGRN2, or hGRN4. We observed widespread punctate and vesicular staining of CTSD indicative of lysosomal localization.69,70 In cells positive for CTSD (green) and hPGRN, hGRN2, or hGRN4 (red), we observed frequent overlapping signals (yellow) suggestive of co-localization (Figure 6A). To assess the co-localization of hGRN and CTSD signals, we utilized IMARIS software to build three-dimensional (3D) models of transduced cells, then detected co-localizing voxels (white). In Grn−/− mice brains injected with AAV-hPGRN, AAV-hGRN2, and AAV-hGRN4, we observed co-localization of all three proteins with CTSD, indicating that GRNs localize to the lysosome in vivo (Figure 6A).
Figure 6. GRNs localize to the lysosome in mouse brain and cultured cells.
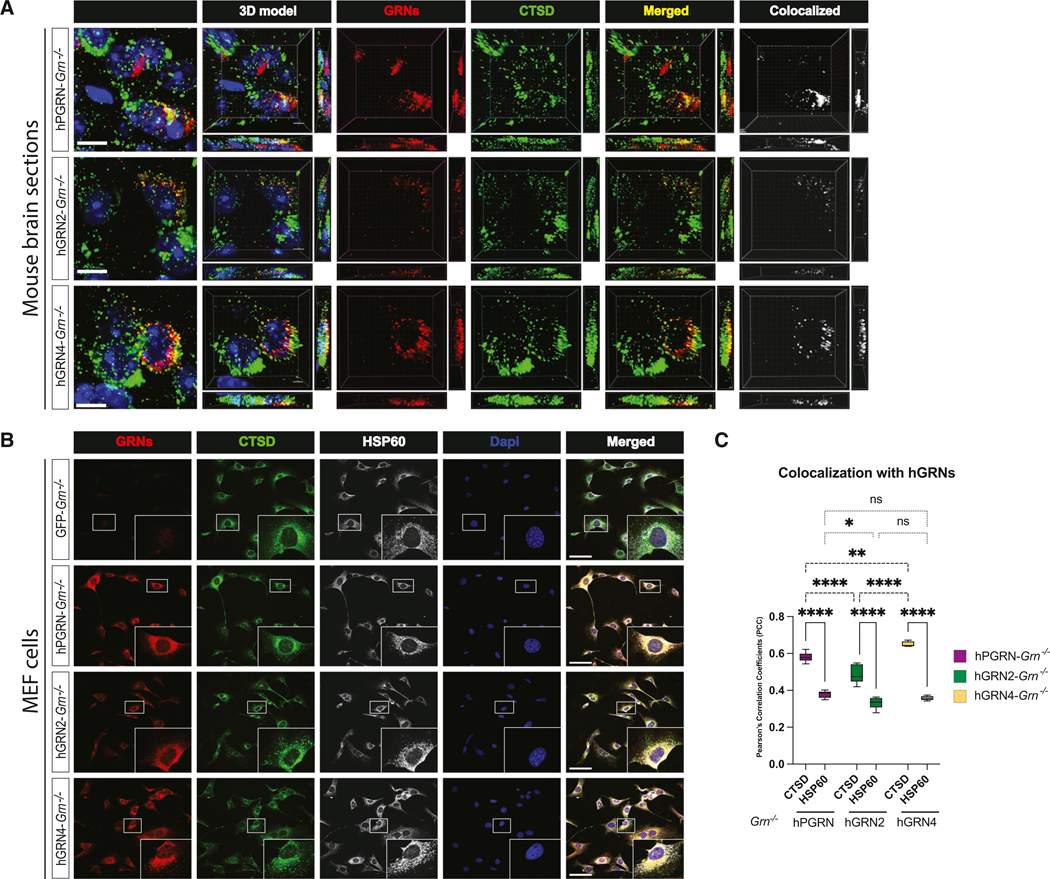
(A) Representative images of fluorescent immunohistochemistry of Grn−/− mice injected with AAV-hPGRN, AAV-hGRN2, or AAV-hGRN4 stained for hGRNs (hPGRN, hGRN2, or hGRN4; red), lysosomal protein cathepsin D (CTSD; green), and nucleus (DAPI stain; blue). Images were analyzed with IMARIS software for voxel co-localization (white). Scale bar: 10 μm.
(B) Representative images of fluorescent immunocytochemistry of MEF Grn−/− TMEM192 3xHA cells expressing hPGRN, hGRN2, and hGRN4 stained for lysosomal protein CTSD (green), hGRNs (PGRN, GRN2, or GRN4; red), mitochondrial protein heat shock protein 60 (HSP60; gray), and nucleus (DAPI stain; blue). Scale bar: 10 μm.
(C) Quantification of Pearson’s correlation coefficients (PCCs) between CTSD and hGRNs vs. HSP60 and hGRNs in MEF Grn−/− TMEM192–3xHA cells expressing hPGRN, hGRN2, or hGRN4.
Data are represented as mean ± SD. n = 5 area/group. p values were determined by two-way ANOVA with Tukey’s post hoc analysis. *p < 0.05, **p < 0.01, ***p < 0.001, and ****p < 0.0001.
We then asked if we could visualize the co-localization of GRNs with lysosomal markers in cells (Figure 6) or detect GRNs in isolated lysosomes (Figure 7). We generated mouse embryonic fibroblast (MEF) Grn−/− cells expressing TMEM192–3xHA, which enables lysosome immunoprecipitation (lyso-IP).71 MEF Grn−/− TMEM192–3xHA lines were transduced with lentivirus to generate cells expressing hPGRN, hGRN2, or hGRN4, and then we performed triple-color fluorescent immunocytochemistry to determine if GRNs (red) co-localized with lysosomes (CTSD; green) or mitochondria (HSP60; gray) (Figure 6B). We observed robust overlapping signals (yellow), indicating the co-localization of CTSD with hPGRN, hGRN2, and hGRN4 (Figure 6B). In contrast, the immunofluorescent signal for mitochondria (HSP60) did not overlap with hPGRN, hGRN2, or hGRN4. We quantified the degree of co-localization by determining the Pearson’s correlation coefficient (PCC) and observed a significant co-localization of GRNs with CTSD compared to HSP60 (Figure 6C). Of note, the PCCs for CTSD were higher for hPGRN- and hGRN4- compared to that of hGRN2-transduced cells, suggesting there may be differences in lysosome trafficking. Higher-magnification images of these cells allow for the visualization of CSTD-positive lysosomes that co-localize with PGRN, hGRN2, and hGRN4 (Figure S7). These data show that the immunofluorescent signal for GRNs is predominantly localized in lysosomes in MEF Grn−/− cells expressing hPGRN, hGRN2, or hGRN4.
Figure 7. GRNs are enriched in the lysosome following lyso-IP.

(A) Lysosome immunoprecipitation (lyso-IP) workflow using MEF Grn−/− cells co-expressing TMEM192–3xHA and hPGRN, hGRN2, or hGRN4.
(B) Immunoblots of cell lysate (cyto), input, and lyso-IP fractions isolated from MEF Grn−/− TMEM192–3xHA cells expressing hPGRN, hGRN2, and hGRN4 probed for lyso-tag (HA), mouse PGRN, hPGRN, hGRN2, hGRN4, lysosome (LAMP1 and CTSZ), mitochondria (HSP60), endoplasmic reticulum (PDI), and cytoskeleton (β-actin).
To generate an orthogonal measure of lysosome localization, we performed lyso-IP on MEF Grn−/− TMEM192–3xHA cell lines expressing hPGRN, hGRN2, or hGRN4 using anti-HA magnetic beads (Figure 7A).71 Lysosome isolation was verified using immunoblot to confirm the enrichment of LAMP1 and CTSZ and the depletion of other organelles, including mitochondria (HSP60), cytoskeleton (β-actin), and endoplasmic reticulum (PDI) (Figure 7B).71 As expected, hPGRN is cleaved into GRN2 and GRN4, and both GRNs are enriched in the lysosome by lyso-IP.26 In MEF Grn−/− TMEM192–3xHA cells expressing hGRN2 or hGRN4, we observe the unprocessed (~15 kDa) precursor in the cell lysate and input, while the cleaved hGRN2 fragment (~6 kDa) or hGRN4 fragment (~8 kDa) is enriched in the lyso-IP sample. Thus, using lyso-IP of MEFs, we find that cleaved GRN2 and GRN4, whether generated from viral expression of hPGRN, hGRN2, or hGRN4, are enriched in the lysosome. In conclusion, both fluorescent immunostaining and lyso-IP reveal that hGRNs are present in the lysosome, providing evidence that the amelioration of disease-associated phenotypes in Grn−/− mice is mediated by the lysosomal function of GRNs.
DISCUSSION
Although it is well established that pathogenic GRN mutations decrease PGRN levels and cause neurodegeneration, the precise function of PGRN is still unclear. In general, full-length PGRN has been proposed to be neurotrophic and anti-inflammatory and function by activating extracellular signaling receptors.4,19 However, this hypothesis does not explain why complete PGRN deficiency causes an LSD. Based on our discovery that PGRN is processed into individual GRNs in the lysosome,72 we tested the idea that the lysosomal GRNs themselves are active. We find that the delivery of an individual GRN (~6 kDa) using rAAV is equally efficacious as hPGRN (~88 kDa) correcting a variety of neuropathologies in Grn−/− mice. This fills a critical gap in our knowledge of PGRN biology, strongly supporting the idea that individual GRNs are the bioactive components of PGRN.
This is an important conceptual advance because, prior to this study, GRNs had been proposed to have the opposite activity of PGRN by causing inflammation,17 neurotoxicity,24 or lysosomal defects.25 In contrast to these competing hypotheses, we find that the expression of two different GRNs in the Grn−/− mouse brain was neuroprotective and reduced markers of neuroinflammation and glial activation. Additional support for our data comes from a study of PTV:PGRN, a brain-penetrant form of hPGRN, that was efficacious weeks after dosing Grn−/− mice, when PGRN has been degraded, suggesting that stable, lysosomal GRNs mediate prolonged efficacy.63 These findings suggest that GRNs have a central role in regulating lysosomal function and lysosomal lipid metabolism and may hold therapeutic potential for neurodegenerative diseases with lysosome dysfunction.73–75
Intriguingly, we find that while neurons are the predominant cell expressing GRNs, we see a rescue of microglial phenotypes (Figure 4), suggesting that neuronal GRNs in Grn−/− mice may have beneficial cell-autonomous and non-cell-autonomous effects. Because the hGRN2 and hGRN4 constructs we employed are secreted (Figure S2B), it is likely they can be taken up by neighboring brain cells to correct dysfunctional lysosomes and gliosis. While we did not see widespread co-localization of hGRNs with microglia (Figure 1F), we did observe rare co-localization (Figure S4B) suggesting some hGRNs may be endocytosed by microglia. In agreement with our data, another study found that AAV-neuronal expression of hPGRN in Grn−/− mice rescued gliosis.68,76 Further experiments with more sensitive techniques are necessary to dissect how neuronal expression of GRNs is beneficial to microglia in Grn−/− mice.
Our findings have important implications for therapeutic development to treat FTD-GRN, AD, and PD. Multiple strategies to increase PGRN in the CNS are being pursued for clinical development, including protein replacement,12 gene therapy,45 and small molecules.77 One approach aims to increase PGRN by depleting sortilin (SORT1), a PGRN lysosomal trafficking receptor, with an antibody (AL001) that has advanced to a phase 3 clinical trial (ClinicalTrials.gov: NCT04374136).11 Antibodies targeting SORT1 increase circulating PGRN in mice78 but decrease lysosomal GRNs in induced pluripotent stem cell (iPSC)-derived neurons.79 Our data raise concerns about this approach because anti-SORT1 antibodies likely raise extracellular PGRN by reducing lysosomal trafficking and decreasing GRN production, which we find prevent lysosome dysfunction caused by PGRN deficiency. At a minimum, our data raise a cautionary note that both PGRN and intra-lysosomal GRN levels should be measured when evaluating pre-clinical therapeutic approaches to treat PGRN deficiency in humans.
Although the precise mechanism through which GRNs are beneficial remains an active area of investigation, we hypothesize that GRNs function inside the lysosome to prevent lipid accumulation, leading to the amelioration of FTD-associated phenotypes. In support of this hypothesis, we show that both hGRN2 and hGRN4 co-localize with the lysosomal protein CSTD in Grn−/− mice and MEF cells. Further, we find that cleaved GRNs are enriched in the lysosomes following lyso-IP of MEF Grn−/− cells expressing hGRN2, hGRN4, or hPGRN. These findings demonstrate that AAV-hGRNs expressed in Grn−/− mice reach the lysosome and support the hypothesis that the lysosomal function of GRNs is responsible for neuroprotection and rescue of lysosome dysfunction and inflammation.
Key questions remain, including whether all GRNs can rescue pathologic phenotypes caused by PGRN deficiency. Further, the molecular function of GRNs inside the lysosome is unsolved, and it is unclear whether each GRN has a unique or overlapping activity. It is feasible that GRNs could contribute to lysosomal function through the stabilization of BMP, which has been suggested as a role of PGRN previously,63 or, similar to the role of saposins, as a co-factor or chaperone in BMP synthesis. Because BMP is a unique and critical lipid for lysosome function, which promotes hydrolase activity,80 rescue of depressed BMP levels could drive the beneficial effect observed with the expression of GRNs. Further experimentation is necessary to test these possibilities and see if all GRNs participate in the same molecular pathways.
From a therapeutic perspective, the small size of GRNs may be advantageous for treating FTD-GRN by crossing the bloodbrain barrier more readily than PGRN. Furthermore, therapies that aim to raise PGRN levels need to consider the impact on GRN levels throughout the CNS. Finally, our data suggest that understanding the function of GRNs inside the endosomal-lysosomal pathway is necessary to decipher how GRNs mediate lysosomal homeostasis and prevent neurodegeneration in FTD-GRN and related disorders.
Limitations of the study
In this study, we tested the efficacy of two out of the seven GRNs in Grn−/− mice. Despite this limitation, we found that hGRN2 and hGRN4 equally corrected major markers of lysosome dysfunction, microglial activation, and lipofuscin in Grn−/− mouse brains. However, in two cases, correction of BMP and GlcSph lipids, hGRN2 was not as efficacious as hGRN4 or hPGRN. Proteomics quantification suggests that this may be due to a 2.5-fold higher expression of hGRN4 compared to hGRN2, which may have limited the efficacy of hGRN2. Alternatively, hGRN2 and hGRN4 may have distinct lysosomal functions, half-lives,81 or lysosomal trafficking efficiency. Although lysosomal receptors for PGRN are known,19,82,83 it is unclear how hGRN2 or hGRN4 traffic to the lysosome and is a focus of future studies. Despite these unanswered questions, the shared ability of hGRN2 and hGRN4 to rescue neuropathology in Grn−/− mice strongly supports further investigation of the bioactivity of all GRNs in vivo.
RESOURCE AVAILABILITY
Lead contact
Requests for reagents will be fulfilled by the lead contact, Thomas Kukar (tkukar@emory.edu).
Materials availability
Plasmids generated in this study are deposited at Addgene. Cell lines and antibodies are available upon request.
Data and code availability
Proteomic data are publicly available and deposited to the ProteomeXchange Consortium via the PRIDE repository (http://www.ebi.ac.uk/pride/archive/projects/PXD041095).
Metabolomic and lipidomic data are publicly available and deposited at Dataverse (https://doi.org/10.15139/S3/7Z2SVL).
No original code was produced, and all scripts and packages used to analyze data have been included in the key resources table.
KEY RESOURCES TABLE.
| REAGENT or RESOURCE | SOURCE | IDENTIFIER |
|---|---|---|
|
| ||
| Antibodies | ||
|
| ||
| Goat polyclonal anti-human progranulin | R and D Systems | Cat# AF2420; RRID: AB_2114489 |
| Rabbit polyclonal anti-human granulin 2 | This paper | N/A |
| Rabbit polyclonal anti-human granulin 4 | This paper | N/A |
| Goat polyclonal anti-mouse galectin-3 | R and D Systems | Cat# AF1197; RRID: AB_2234687 |
| Goat polyclonal anti-mouse cathepsin Z | Thermo Fisher Scientific | PA5–47048; RRID: AB_2576470 |
| Rabbit monoclonal anti-mouse CD68 | Cell Signaling Technology | Cat# 97778; RRID: AB_2928056 |
| Goat polyclonal anti-GFP | Rockland | Cat# 600–101-215; RRID: AB_218182 |
| Rabbit polyclonal anti-Beta Tubulin | Cell Signaling Technology | Cat#2146; RRID: AB_2210545 |
| Rabbit recombinant monoclonal Histone H3 | Cell Signaling Technology | Cat#4499; RRID: AB_10544537 |
| Chicken anti-MAP2 | Neuromics | Cat# CH22103; RRID: AB_2314763 |
| Goat polyclonal anti-AIF-1/Iba1 | Novus | Cat# NB100–1028 RRID: AB_521594 |
| Mouse monoclonal anti-Glial Fibrillary Acidic Protein (GFAP) | Sigma-Aldrich | Cat# G3893 RRID: AB_477010 |
| Chicken anti-HSP60 | EnCor Biotechnology | Cat#CPCA-HSP60 RRID: AB_2572330 |
| Mouse monoclonal anti-Strep-TagII (C23.21) | Absolute Antibody | Ab02208–1.1 |
| Strep-TactinXT-HRP | IBA Lifesciences | custom |
| Goat anti-rabbit IgG (H + L) DyLight800 | Cell Signaling Technology | Cat# 5151; RRID: AB_10697505 |
| Goat anti-mouse IgG IRDye 680RD | LI-COR Biosciences | Cat#925–68070 RRID:AB_2651128 |
| Donkey anti-goat IgG (H + L) Cross-Adsorbed Secondary Antibody, Alexa Fluor 568 | Thermo Fisher Scientific | Cat# A-11057 RRID: AB_2534104 |
| Donkey anti-chicken IgY (IgG) (H + L), Alexa Fluor 488 | Jackson ImmunoResearch Labs | Cat# 703–545−155; RRID: AB_2340375 |
| Donkey anti-mouse IgG (H + L) Antibody, Alexa Fluor 488 Conjugated | Thermo Fisher Scientific | Cat# A21202 RRID: AB_141607 |
| Donkey anti-Rabbit Cy5-AffiniPure | Jackson ImmunoResearch Labs | Cat# 711–175-152 RRID: AB_2340607 |
| Goat anti-Rabbit HRP | Cell Signaling Technology | Cat#7074P2; RRID: AB_2099233 |
| Donkey anti-Goat IgG (H + L) Highly Cross-Adsorbed Secondary Antibody, Alexa Fluor Plus 800 | Thermo Fisher Scientific | Cat#A32930; RRID: AB_2762842 |
| Donkey anti-Rabbit IgG (H + L) Highly Cross-Adsorbed Secondary Antibody, Alexa Fluor Plus 680 | Thermo Fisher Scientific | Cat#A32802; RRID: AB_2762836 |
| Biotinylated horse anti-rabbit IgG (H + L) | Vector Laboratories | Cat#: BA-1100–1.5; RRID: AB_2336201 |
| Biotinylated horse anti-goat IgG (H + L) | Vector Laboratories | Cat#: BA-9500–1.5; RRID: AB_2336123 |
| Biotinylated rabbit anti-sheep immunoglobulin | Vector Laboratories | Cat#: BA-6000–1.5 RRID: AB_2336217 |
|
Bacterial and virus strains | ||
| Lentivirus pLJC5-Tmem192–3xHA | This paper | RRID:Addgene_102930 |
| Lentivirus pLV[Exp]-EGFP:T2A: Hygro-hPGK>{N-TAP PGRN} | VectorBuilder | Catalog #: LVS(VB190712–1034dkb)-C |
| Lentivirus pLV[Exp]-EGFP:T2A: Hygro-hPGK>{GRN2+linker} | VectorBuilder | Catalog #: LVS(VB190712–1032cbw)-C |
| Lentivirus pLV[Exp]-EGFP:T2A: Hygro-hPGK>{GRN4+linker} | VectorBuilder | Catalog #: LVS(VB190712–1030aad)-C |
| rAAV1 strep-GFP | This Paper | Addgene; cat # in progress |
| rAAV1 hPGRN | This Paper | Addgene; cat # in progress |
| rAAV1 hGRN4 | This Paper | Addgene; cat # in progress |
| rAAV1 hGRN2 | This Paper | Addgene; cat # in progress |
|
Chemicals, peptides, and recombinant proteins | ||
| DAPI Nucleic Acid Stain | Thermo Fisher Scientific | Cat# 62248; CAS: 28718–90-3 |
| Pink Rino Tubes | Next Advance | Cat# PINKR1-RNA |
| Bullet Block | Nacalai | Cat# 13779–01 |
| HALT Protease and phosphatase inhibitor | Thermo Fisher Scientific | Cat# UK286007 |
| Diaminobenzidine (DAB) | TCI-Chemicals | Cat# D0077 |
| Pertex Mounting medium | CellPath | Cat# SEA-0100–00A |
| Epredia Immu-Mount | Fisher Scientific | Cat# 9990402 |
| SuperSignal West Femto Maximum Sensitivity Substrate |
Thermo Fisher Scientific | Cat# 34095 |
| Opti-MeM Reduced Serum Media | Gibco | Cat# 31985070 |
| DMEM high glucose, pyruvate | Gibco | Cat# 11995073 |
| Benzonase® | Sigma | Cat# E8263–25KU |
| HiTrap Q HP column | Amersham Biosciences | Cat# 17115401 |
| Lysyl endopeptidase | WAKO | Cat# 125–05061 |
| Trypsin | Pierce | Cat# 90059 |
| Sep-Pak C18 column | Waters | Cat# WAT036945 |
| 18-plex Tandem Mass Tag (TMTPro) kit | Thermo Fisher Scientific | Cat# A44520 and A52046 |
| 60mg HLB column | Waters | Cat# WAT094226 |
| BEH column | Waters | Cat# 186002353 |
| ReproSil-Pur: 120 C18-AQ 1.9um | Dr. Maisch HPLC GmbH | Cat# r119.aq.0001 |
| ACQUITY Premier BEH C18 Column, 1.7 μm, 2.1 × 100 mm |
Waters | Cat# 186009453 |
| ACQUITY Premier BEH Amide Column, 1.7 μm, 2.1 mm × 150 mm |
Waters | Cat#186009506 |
| HALO HILIC 2.0 μm, 3.0 × 150 mm column | Advanced Materials Technology | Cat#PN 91813–701 |
| REVERT total Protein Stain | LI-COR | Cat#926–11010 |
| Fish Serum Blocking Buffer | Thermo Fisher Scientific | Cat#37527 |
| Lysing Matrix D tubes | MP Biomedicals | Cat#116913050 |
| MES Running Buffer | Genscript | Cat#M00677 |
| ZymoPURE II Plasmid Maxiprep kit | Zymo Research | Cat#Z5139 |
| TransIT-LT1 Transfection reagent | Mirus Bio | Cat#MIR 2300 |
| Denarase | c-LEcta | Cat#VWR-20804–100K |
| Anti-HA magnetic beads | Thermo Fisher Scientific | Cat#88836 |
|
Critical commercial assays | ||
| Mouse on Mouse ImmPress HRP Polymer kit | Vector Laboratories | Cat#MP-2400 |
| Avidin-biotin-peroxidase complex (ABC) | Vector Laboratories | Cat#PK-6100 |
| Mouse GPNMB ELISA | R and D Systems | Cat#DY2330 |
| Human PGRN ELISA | R and D Systems | Cat#DY2420 |
|
Deposited data | ||
| Mouse brain proteomic dataset | This paper; https://www.ebi.ac.uk/pride | PXD041095 |
| Mouse brain metabolomics and lipidomics dataset | This paper; https://dataverse.unc.edu/dataverse/Emory | https://doi.org/10.15139/S3/7Z2SVL |
|
Experimental models: Cell lines | ||
| HeLa Grn+/+ | Nguyen et al.84 | N/A |
| HeLa Grn−/− | Nguyen et al.84 | N/A |
| MEF Grn−/− | Nguyen et al.84 | N/A |
| MEF Grn+/+ | Nguyen et al.84 | N/A |
| HEK293T | ATCC | Cat# CRL-3216; RRID:CVCL_0063 |
|
Experimental models: Organisms/strains | ||
| Top10 E coli | Invitrogen | Cat#C404010 |
| B6(Cg)-Grntm1.1Aidi | Jackson Labs | IMSR Cat# JAX:013175; RRID: IMSR_JAX:013175 |
|
Recombinant DNA | ||
| pLV[Exp]-EGFP:T2A:Hygro-hPGK>{N-TAP PGRN} | VectorBuilder | Catalog #: Ecoli(VB190712–1034dkb) |
| pLV[Exp]-EGFP:T2A:Hygro-hPGK>{GRN2+linker} | VectorBuilder | Catalog #: Ecoli(VB190712–1032cbw) |
| pLV[Exp]-EGFP:T2A:Hygro-hPGK>{GRN4+linker} | VectorBuilder | Catalog #: Ecoli(VB190712–1030aad) |
| pLJC5-Tmem192–3xHA | Addgene | RRID: Addgene_102930 |
| pCMV-VSV-G | Addgene | RRID: Addgene_8454 |
| pCMV-dR8.2 dvpr | Addgene | RRID: Addgene_8455 |
| pAAV strep-GFP | This Paper | Addgene; cat # in progress |
| pAAV hPGRN | This Paper | Addgene; cat # in progress |
| pAAV hGRN4 | This Paper | Addgene; cat # in progress |
| pAAV hGRN2 | This Paper | Addgene; cat # in progress |
|
Software and algorithms | ||
| Proteome Discoverer Suite (v.2.4.1.15) | Thermo Fisher Scientific | RRID:SCR_014477 |
| Prism 9 | Graphpad Software |
https://www.graphpad.com/scientificsoftware/prism/; RRID:SCR_002798 |
| IMARIS 10.0.1 | Oxford Instruments | https://imaris.oxinst.com/support/imarisrelease-notes/10-0-0; RRID:SCR_007370 |
| BioRender | https://www.biorender.com | RRID:SCR_018361 |
| PCAtools R package | Blighe et al.84 | https://github.com/kevinblighe/PCAtools |
| Metascape | Zhou et al.85 | https://metascape.org; RRID:SCR_016620 |
| Quickomics | Gao et al.86 | https://quickomics.bxgenomics.com/ |
| Ggmsa R package | Zhou et al.87 | https://github.com/YuLab-SMU/ggmsa |
| Bio3D R package | Grant et al.88 |
http://thegrantlab.org/bio3d/; RRID:SCR_024266 |
| CellProfiler | Lamprecht et al.89 | www.cellprofiler.org;RRID:SCR_007358 |
| Msa R | Bodenhofer et al.90 | https://github.com/UBod/msa |
| Ggplot2 | Wickham91 |
https://ggplot2.tidyverse.org; RRID:SCR_014601 |
| SCIEX OS 3.1 | Sciex | https://sciex.com/br/products/software/sciex-os-software |
| Microsoft R Open v3.4.2 | Microsoft | https://mran.microsoft.com |
| LI-COR Image Studio | LI-COR | RRID:SCR_015795 |
| Adobe Illustrator | Adobe | RRID:SCR_010279 |
| Adobe Photoshop | Adobe | RRID:SCR_014199 |
STAR★METHODS
EXPERIMENTAL MODEL AND SUBJECT DETAILS
Mouse model and neonatal rAAV injections
The Grn−/− mice used in this study were purchased from the Jackson Laboratory (B6(Cg)-Grntm1.1Aidi/, IMSR Cat# JAX:013175, RRID: IMSR_JAX:013175) and generated as previously described. Mice were bred and housed in the Department of Animal Resources at Emory University and all work was approved by the Institutional Animal Care and Use Committee (IACUC) and performed in accordance with the Guide for the Care and Use of Laboratory Animals of the National Institutes of Health. Postnatal day 0 (P0) mouse pups (GRN+/+ or GRN−/−) were injected with rAAV vectors.41 Briefly, P0 pups were cryoanesthetized on ice for 5 min in a nest protected by aluminum foil. One microliter of rAAV was injected intracerebroventricular (ICV) into both hemispheres using a 10 mL Hamilton syringe with a 30-gauge needle. The pups were then placed on a heating pad with their original nesting material for 3–5 min and returned to their mother for further recovery. Male and female mice were injected in a randomized manner. Treatment group was determined by litter, as one litter received a single virus type on a rotating basis. Between 2 and 3 litters were injected with each construct to achieve cohort size. Data from 32 females and 26 males are included in this study.
Cell culture
HeLa GRN−/− cells were a gift from Dr. Shawn Ferguson (Yale University) and generated using CRISPR as described.78 The progenitors of modern HeLa cells were collected at John’s Hopkins from cervical cancer patient Henrietta Lacks in 1951 an African American woman living near Baltimore. The cells were collected without her or her family’s knowledge or consent, we encourage all who use these cell lines to acknowledge and consider the history of these cells.92 HeLa wild-type or GRN−/− cells were cultured in DMEM medium plus 10% fetal bovine serum (FBS) and 1% Pen/Strep and maintained at 37°C with 5% CO2. 24 h before collection DMEM media was replaced with Opti-MEM media (Gibco).
HEK293T cells used to generate lentiviral constructs were acquired from ATCC (RRID: CVCL_0063). This cell line originated from female embryonic kidney cells.93 Cells were cultured in DMEM medium plus 10% fetal bovine serum (FBS) and 1% Pen/Strep and maintained at 37°C with 5% CO2.
MEF Grn+/+ and Grn−/− cells (parental lines), a gift from Dr. Robert Farese (Harvard University), were cultured in DMEM medium, supplemented with 10% heat-inactivated fetal bovine serum (hi-FBS) at 37°C and 5% CO2 environment. Cells were cultured for two passages after thaw and prior to lentiviral transduction to generate stable line for lysosomal immunoprecipitation (Lyso-IP). Cell count was estimated using a TC20 Automated Cell Counter (Bio-Rad).
METHOD DETAILS
Production of recombinant adeno-associated virus
Four purified recombinant adeno-associated virus vectors (rAAVs) for injection were produced by plasmid transfection with helper plasmids in HEK293T cells. Briefly, the coding sequence of twin-Strep-GFP (GFP), twin-Strep-V5 human progranulin (hPGRN), twin-Strep-FLAG-granulin-2 with linker region 3 (hGRN2) and twin-Strep-FLAG-granulin-4 with linker region 5 (hGRN4) were subcloned from a pcDNA3.1 expression plasmid into pAAV. hPGRN, hGRN2, and hGRN4 all contain the native hPGRN signal peptide at the N terminus. The AAV vectors express hPGRN, hGRN2, hGRN4, or GFP under the control of the cytomegalovirus enhancer/chicken β-actin promoter, a woodchuck post-transcriptional regulatory element, and the bovine growth hormone, poly(A), and were generated by plasmid transfection with helper plasmids in HEK293T cells. Forty-eight hours after transfection, the cells were harvested and lysed in the presence of 0.5% sodium deoxycholate and 50 U/ml Benzonase (Sigma, St. Louis, MO) by freeze thawing, and the virus was isolated using a discontinuous iodixanol gradient and affinity purified on a HiTrap HQ column (Amersham Biosciences, Arlington Heights, IL). The genomic titer of each virus was determined by quantitative PCR.
Collection of brain tissue
Mice were sacrificed after 12 months and brains were processed in two downstream pathways. Brains from half of the individuals from each cohort were immediately dissected from the skull and frozen at −80C. Whole brains were later thawed on ice and cortical, hippocampal, and thalamic sections were bulk dissected from the brain and frozen immediately at −80C. Remaining animals were transcardially perfused using ice-cold PBS then fixed in methanol-free 4% PFA before dissecting all brains and storing in 4% PFA for 24 h before transferring samples to 30% sucrose, which was replaced at 24 and 48 h. The final storage solution was 30% sucrose and 1% sodium azide. Fixed tissue was stored at 4°C until it was prepared for sectioning. Brain sectioning was performed using a freezing microtome set to 40 μm. Brains were frozen in ground dry ice, then mounted with 30% sucrose onto the pre-frozen sectioning stage, where serial sections were collected from the entire brain and stored in 30% sucrose, 30% ethylene glycol and 1% sodium azide. Frozen hippocampal and cortical brain samples from 12-month-old Grn+/+ (n = 27) and Grn−/− (n = 44) mice were allocated for further processing.
Thalamic proteomics sample preparation
Each tissue sample was homogenized in 300 μL of 8 M urea/100 mM NaHPO4, pH 8.5 with HALT protease and phosphatase inhibitor cocktail (Pierce) using a Bullet Blender (Next Advance) according to manufacturer protocols. Briefly, tissue lysis was transferred to a 1.5 mL Rino tube (Next Advance) with 350 mg stainless steel beads (0.9–2 mm in diameter) and blended for 5-min intervals, two times, at 4°C. Protein supernatants were sonicated (Sonic Dismembrator, Fisher Scientific) three times for 5 s, with 15 s intervals of rest, at 30% amplitude to disrupt nucleic acids, in 1.5 mL Eppendorf tubes. Protein concentration was determined by BCA method, and aliquots were frozen at −80°C. Protein homogenates (200 μg) were treated with 1 mM dithiothreitol (DTT) at 25°C for 30 min, followed by 5 mM iodoacetimide (IAA) at 25°C for 30 min in the dark. Proteins were digested with 1:25 (w/w) lysyl endopeptidase (Wako) at 25°C for overnight followed by another overnight digestion with 1:25 (w/w) trypsin (Pierce) at 25°C after dilution with 50 mM NH4HCO3 to a final concentration of 1 M urea. The resulting peptides were desalted on a Sep-Pak C18 column (Waters) and dried under vacuum. All samples were across 2 batches and labeled with an 18-plex Tandem Mass Tag (TMTPro) kit (ThermoFisher, Lot numbers: UK297033 and WI336758) according to manufacturer’s protocol. Each TMT batch was desalted with 60 mg HLB columns (Waters) and dried via speed vacuum (Labconco). Dried samples were re-suspended in high pH loading buffer (0.07% v/v NH4OH, 0.045% v/v FA, 2% v/v ACN) and loaded onto a Water’s BEH column (2.1 mm × 150 mm with 1.7 μm particles). A Vanquish UPLC system (ThermoFisher Scientific) was used to carry out the fractionation. Solvent A consisted of 0.0175% (v/v) NH4OH, 0.01125% (v/v) FA, and 2% (v/v) ACN; solvent B consisted of 0.0175% (v/v) NH4OH, 0.01125% (v/v) FA, and 90% (v/v) ACN. The sample elution was performed over a 25 min gradient with a flow rate of 0.6 mL/min with a gradient from 0 to 50% solvent B. A total of 192 individual equal volume fractions were collected across the gradient. Fractions were concatenated to 96 fractions and dried to completeness using vacuum centrifugation. Dried peptide fractions were resuspended in 20 μL of peptide loading buffer (0.1% formic acid, 0.03% trifluoroacetic acid, 1% acetonitrile). Peptide mixtures (2 μL) were separated on a self-packed C18 (Dr. Maisch) fused silica column (15 cm × 150 μm internal diameter) by a Dionex Ultimate rsLCnano and monitored on a Fusion Lumos mass spectrometer (ThermoFisher). Elution was performed over a 42 min gradient at a rate of 1250 nL/min with buffer B ranging from 1% to 99% (buffer A: 0.1% formic acid in water, buffer B: 0.1% formic in 80% acetonitrile). The mass spectrometer cycle was programmed to collect at the top speed for 3 s cycles. The MS scans (410–1600 m/z range, 400,000 AGC, 50 ms maximum ion time) were collected at a resolution of 60,000 at m/z 200 in profile mode. HCD MS/MS spectra (0.7 m/z isolation width, 35% collision energy, 125,000 AGC target, 86 ms maximum ion time) were collected in the Orbitrap at a resolution of 50000. Dynamic exclusion was set to exclude previous sequenced precursor ions for 20 s within a 10-ppm window. Precursor ions with +1 and +8 or higher charge states were excluded from sequencing.
Thalamic proteomics data processing
All raw files were analyzed using the Proteome Discoverer Suite (v.2.4.1.15, ThermoFisher). MS/MS spectra were searched against the UniProtKB mouse proteome database (downloaded in August 2020 with 91417 total sequences) supplemented with 4 variant sequences (twin-Strep-GFP, hGRN2, hGRN4, and hPGRN). The Sequest HT search engine was used to search the RAW files, with search parameters specified as follows: fully tryptic specificity, maximum of two missed cleavages, minimum peptide length of six, fixed modifications for TMTPro tags on lysine residues and peptide N-termini (+304.207 Da) and carbamidomethylation of cysteine residues (+57.02146 Da), variable modifications for oxidation of methionine residues (+15.99492 Da), serine, threonine and tyrosine phosphorylation (+79.966 Da) and deamidation of asparagine and glutamine (+0.984 Da), precursor mass tolerance of 10 ppm and a fragment mass tolerance of 0.05 Da. Percolator was used to filter peptide spectral matches and peptides to an FDR <1%. Following spectral assignment, peptides were assembled into proteins and were further filtered based on the combined probabilities of their constituent peptides to a final FDR of 1%. Peptides were grouped into proteins following strict parsimony principles.
Differential expression analysis
Differentially enriched or depleted proteins (p % 0.05) were identified by one-way ANOVA with post-hoc Tukey HSD test comparing five groups: GFP-Grn+/+, GFP-Grn−/−, PGRN-Grn−/−, GRN2-Grn−/−, GRN4-Grn−/− mice. Differential expression of proteins was visualized with volcano plots generated using the ggplot294 package in Microsoft R Open v3.4.2. Significantly differentially expressed proteins were determined by both having a p % 0.05 and a fold change difference of greater than log2(1.25) or less than − log2(1.20) (a minimum 1.2-fold change).
Proteomics analysis and visualization
Differential expression data from comparisons of GFP-Grn+/+ vs. GFP-Grn−/−, GFP-Grn−/− vs. hPGRN-Grn−/−, GFP-Grn−/− vs. hGRN2-Grn−/−, and GFP-Grn−/− vs. hGRN4-Grn−/− including adjusted p values, and abundance values were imported into Quickomics, an R-shiny powered proteomics analysis and visualization tool.91 GIS internal standards were removed from the dataset and Heatmaps were created filtering proteins from the GFP-Grn+/+ vs. GFP-Grn−/− comparison with and adjusted p-value of <0.05 and a fold change value of at least 1.2 or 20%. Clustering was performed grouping proteins by the similarity across the sample ID using a k-means approach. Other visualizations created in Quickomics include 2-Way DEG plots and PCA visualizations. Additional PCA analysis was undertaken in R using the PCAtools package.86
Gene ontology (GO)
Genes IDs identified from proteins determined to be differentially abundant (adjusted p-value 0.05, FC 1.2) between GFP-Grn+/+, GFP-Grn−/− mice were input into the Metascape Gene Ontology Analysis tool (https://metascape.org).95 Express Analysis was conducted, and the top 50 Ontology Terms were collected.
Lipidomics and metabolomics
Sample preparation for lipidomics and metabolomics analyses
During tissue collection, the cortex was dissected, weighed, and flash frozen. Each frozen cortex was pulverized into a homogeneous powder, and roughly 30 mg of each cortex powder sample was used to extract lipids. Methanol spiked with internal standards (see LCMS methods below) was added to each sample and homogenized with FastPrep-24 5G bead beating grinder and lysis system using Lysing Matrix D tubes with CoolPrep adapter (MP Biomedicals) for 40 s at a speed of 6 m/s. The methanol fraction was then isolated via centrifugation (20 min at 4°C, 14,000 x g), followed by transfer of supernatant to a 96 well plate. After a 1 h incubation at 20°C followed by an additional centrifugation (20 min, 4,000 x g at 4°C), methanol was transferred to glass vials for LCMS analysis.
Lipidomics analysis
Lipid analyses were performed by liquid chromatography on an ExionLC (Sciex) coupled with electrospray mass spectrometry TripleQuad 7500 (Sciex). For each analysis, 1 μL of the sample was injected on a Premier BEH C18 1.7 μm, 2.1 × 100 mm column (Waters) using a flow rate of 0.25 mL/min at 55°C. For positive ionization mode, mobile phase A consisted of 60/40 (v/v) acetonitrile/water with 10 mM ammonium formate +0.1% formic acid; mobile phase B consisted of 90/10 (v/v) isopropyl alcohol/acetonitrile with 10 mM ammonium formate +0.1% formic acid. For negative ionization mode, mobile phase A consisted of 60/40 (v/v) acetonitrile/water with 10 mM ammonium acetate; mobile phase B consisted of 90/10 (v/v) isopropyl alcohol/acetonitrile with 10 mM ammonium acetate. The gradient was programmed as follows: 0.0–8.0 min from 45% B to 99% B, 8.0–9.0 min at 99% B, 9.0–9.1 min to 45% B, and 9.1–10.0 min at 45% B. Electrospray ionization was performed in positive or negative ion mode. We applied the following settings: curtain gas at 40 psi (negative mode) and curtain gas at 40 psi (positive mode); collision gas was set at 9; ion spray voltage at 2000 V (positive mode) or −2000 V (negative mode); temperature at 250°C (positive mode) or 450°C (negative mode); ion source Gas 1 at 40 psi; ion source Gas 2 at 70 psi; entrance potential at 10 V (positive mode) or −10 V (negative mode); and collision cell exit potential at 15 V (positive mode) or −15 V (negative mode). Data acquisition was performed in multiple reaction monitoring mode (MRM) with the collision energy (CE) values reported in Tables S3 and S4. Area ratios of endogenous lipids and surrogate internal standards were quantified using SCIEX OS 3.1 (Sciex).
Metabolomics analysis
Metabolites analyses were performed by liquid chromatography on an ExionLC (Sciex) coupled with electrospray mass spectrometry TripleQuad 7500 (Sciex). For each analysis, 1 μL of the sample was injected on a Premier BEH amide 1.7 μm, 2.1 × 150 mm column (Waters) using a flow rate of 0.40 mL/min at 40°C. Mobile phase A consisted of water with 10 mM ammonium formate +0.1% formic acid. Mobile phase B consisted of acetonitrile with 0.1% formic acid. The gradient was programmed as follows: 0.0–1.0 min at 95% B; 1.0–7.0 min to 50% B; 7.0–7.1 min to 95% B; and 7.1–10.0 min at 95% B. Electrospray ionization was performed in positive ion mode. We applied the following settings: curtain gas at 40 psi; collision gas was set at 9; ion spray voltage at 1600 V; the temperature at 350°C; ion source Gas 1 at 30 psi; ion source Gas 2 at 50 psi; entrance potential at 10 V; and collision cell exit potential at 10 V. Data acquisition was performed in MRM mode with the CE values reported in Table S5. Area ratios of endogenous metabolites and surrogate internal standards were quantified using SCIEX OS 3.1 (Sciex).
Analysis of glucosyl- and galactosyl-sphingolipids
Glucosyl- and galactosyl-sphingolipids analyses were performed by liquid chromatography ExionLC coupled to electrospray mass spectrometry TQ7500. For each analysis, 1 μL of sample was injected on a HALO HILIC 2.0 μm, 3.0 × 150 mm column (Advanced Materials Technology) using a flow rate of 0.48 mL/min at 45°C. Mobile phase A consisted of 92.5/5/2.5 (v/v/vol) acetonitrile/isopropanol/water with 5 mM ammonium formate and 0.5% formic acid. Mobile phase B consisted of 92.5/5/2.5 (v/v/vol) acetonitrile/isopropanol/water with 5 mM ammonium formate and 0.5% formic acid. The gradient was programmed as follows: 0.0–2 min at 0% B, 2.1 min at 5% B, 4.5 min at 15% B, hold to 6.0 min at 15% B, up to 100% B at 6.1 min and hold to 7.0 min, drop back to 0% B at 7.1 min and hold to 8.5 min. Electrospray ionization was performed in positive ion mode. We applied the following settings: curtain gas at 40 psi; collision gas was set at 9 psi; ion spray voltage at 2250 V; temperature at 450°C; ion source Gas 1 at 40 psi; ion source Gas 2 at 70 psi; entrance potential at 10 V; and collision cell exit potential at 15 V. Area ratios of endogenous glucosyl- or galactosyl-sphingolipids and surrogate internal standards (Table S6) were quantified using SCIEX OS 3.1 (Sciex).
Generation of human granulin antibodies
Polyclonal antibodies that specifically recognize human granulin-2 or granulin-4 were generated by immunizing rabbits with recombinant antigen followed by affinity purification of sera. Briefly, synthetic genes were designed to encode a dual polyhistidine (His) and albumin binding protein (ABP) tag at the N terminus of hGRN2 or hGRN4. His-ABP-hGRN2 and His-ABP-hGRN4 were made recombinantly in E. coli Shuffle T7 cells (NEB). Proteins were sequentially purified over Ni2+-columns (cOmplete His-tagged resin; Millipore – Sigma) then a human serum albumin column (ProteinMods) following the manufacturer’s protocols under native condition. Purified His-ABP-hGRN2 and His-ABP-hGRN4 were used to immunize rabbits (n = 2) with complete Freund’s adjuvant by Pocono Rabbit Farm and Laboratory following their 70-day antibody production protocol. Rabbit sera that were immunopositive for hGRN2 or hGRN4 by ELISA and immunoblot were then purified over a protein A column to isolate IgG followed by a column (AminoLink; ThermoFisher Scientific) that had been pre-coupled with twin-strep-tagged hGRN2 or hGRN4 made in Expi293F cells (Thermo-Fisher Scientific) as previously described.26 Anti-hGRN2 or anti-hGRN4 rabbit antibodies were eluted with gentle Ag/Ab elution buffer, pH 6.6 (Thermo-Fisher Scientific). Elutions were pooled, dialyzed into PBS, then concentrated in a 50 kDa Amicon 4 mL ultra-centrifugal Filter (Millipore - Sigma).
Immunohistochemistry
Paraformaldehyde fixed coronal tissue sections from each group of rAAV-injected mice were stained with multiple antibodies including, StrepTagII C23.21 antibody, lysosomal proteins (CathZ, Gal3), and microglial protein CD68 using previously published procedures.39,42 The full list of antibodies is listed in the key resources table. For this procedure, 40 μm coronal brain sections were processed using a free-floating method. For StrepTagII and CD68 antibodies, antigen retrieval with Citrate buffer pH 6.0 at 80° (30 min) was performed for epitope retrieval. Sections were rinsed three times in phosphate-buffered saline containing 0.3% Triton X-100 (PBST) (0.1M Phosphate buffer, pH 7.4, 0.137 M NaCl, 0.3% Triton X-100) and reacted in PBST containing 1% hydrogen peroxide (30 min) to remove endogenous peroxidase activity, rinsed three times in PBST, blocked with 2.5% normal horse serum, and then incubated in optimal dilutions of antibody overnight with shaking at room temperature (RT). Sections were then rinsed three times, incubated in biotinylated anti-species immunoglobulin (Vector Laboratories) at 1:1000 for 1 h at room temperature, rinsed three times and then incubated with avidin-biotin-peroxidase complex (ABC) for an hour (Vector Laboratories). Localization of bound antibody was visualized using avidin-biotin horseradish peroxidase (HRP) enzyme complex histochemistry and nickel ammonium sulfate-enhanced diaminobenzidine-HCl (100 μg/mL) (TCI Chemicals, Tokyo, Japan) as a substrate to produce a dark purple reaction product. Sections were then mounted on microscope slides, dehydrated, and coverslipped with Pertex mounting medium.
For detection of the twin-Strep tag on constructs, the StrepTagII C23.21 antibody was visualized using the Mouse on Mouse ImmPress HRP Polymer kit (Vector Laboratories) according to the manufacturer’s protocol. Tissue slides were imaged with a slide scanner (Leica Aperio AT2) and the IHC signal of cortical, thalamic, and hippocampal regions were cropped from a whole coronal section image. Brain regions of interest analyzed using an automated pipeline created using CellProfiler (www.cellprofiler.org)85 for quantification.
Fluorescent immunohistochemistry
Double-color fluorescent immunohistochemistry was carried out to verify cellular co-localization of PGRN, GRN2, and GRN4-expressing cells in hGRNs-Grn−/− mice with cellular antigenic markers such as neuronal marker (Map2), microglial marker (Iba-1), astrocyte marker (Gfap), and a lysosomal marker (CTSD). Tissue sections were rinsed three times in PBST, blocked with 2.5% normal donkey serum for 30 min, and followed by incubation with optimal dilutions of antibodies at 4◦ overnight with shaking. After three washes (10 min each) in PBST, sections were incubated with optimal concentrations of fluorescent-labeled secondary antibodies and DAPI (1ug/ml) mixture. Bound primary antibodies were detected with Alexa Fluor 488 donkey anti-chicken or anti-mouse IgG, Alexa Fluor 568-donkey anti-goat IgG, and Cy5-donkey anti-rabbit IgG. After three washes, sections were mounted, coverslipped with Immu-mount fluorescent mounting media (Thermo Fisher) and imaged using Lecia DMi 8 or Lecia STELLARIS SP8 microscope with a DFC9000 GT camera and system software (LAS X Life Science microscope software).
IMARIS colocalization
Three-dimensional visualization and analysis of colocalization between lysosomal marker, CTSD and granulins in hPGRN, hGRN2, and hGRN4 injected mouse brain tissue sections, we employed IMARIS (v.10.0, Bitplane). After acquiring images with a Leica SP8 Stellaris, the datasets were imported into IMARIS for volumetric reconstruction. Thresholding was set using fluorescent secondary antibody only stained sections to minimize background noise and optimize the accuracy of colocalization detection. We used the software’s ‘Coloc’ function to visualize colocalization within the reconstructed 3D models. A Colocalization channel was built, assigned to white color, and exported.
HeLa lysis and media collection
Cells were suspended in MES buffer (50 mM MES pH 6.5, 1% Triton, 150 μM NaCl, 1XHALT PPI) 5 μL for every 1 mg cell pellet. Cells were then lysed on ice for 10 min briefly vortexing every 3 min. Lysates were then spun at 600xg for 10 min and supernatant was collected. Conditioned media was collected from culture dish and spun at 500xg for 10 min to remove any cell debris.
Lentiviruses
pLJC5-Tmem192–3xHA (cat. 102930), pCMV-VSV-G (cat. 8454) and pCMV-dR8.2 dvpr (cat. 8455) were acquired from Addgene as bacterial stabs. Plasmids were propagated in TOP10 competent E. coli (Invitrogen), plasmid DNA was extracted and purified with a ZymoPURE II Plasmid Maxiprep kit (Zymo Research). TMEM192_3xHA lentiviruses were generated as previously described.71 Briefly, 500,000 HEK293T cells per well were seeded into 6-well plates in DMEM/10% hi-FBS. Cells were transfected the next day with the pLJC5-Tmem192– 3xHA, VSV-G and CMV- ΔVPR with TransIT-LT1 Transfection reagent (Mirus Bio). After an 18-h incubation period, growth medium was changed to DMEM/30% hi-FBS. 48 h later, the medium was collected, centrifugated at 1,000 x g for 5 min to get rid of dead cells, aliquoted and stored at −80°C. pLV[Exp]-EGFP:T2A:Hygro-hPGK> lentiviruses packaged with either N-tap-PGRN, GRN2+Linker 3 or GRN4+Linker 5, included the same coding region from AAV plasmids used for mouse neonatal injections and were produced by VectorBuilder, Inc.
Lentiviral transductions
Transduction of MEF Grn+/+ and Grn−/− cells and selection was performed as previously described.71 Transduced MEF cell pools were maintained in DMEM, hi-FBS, and 1–2 μg/mL puromycin and subjected to clonal isolation. The clones were expanded and assessed for TMEM192_3xHA expression via western blot. The clones with robust TMEM-3xHA expression were chosen, expanded, and frozen. To generate PGRN or granulin add-back pools, PGRN_EGFP and GRN2L3_EGFP lentiviruses (VectorBuilder Inc.) were used to transduce TMEM192_3xHA-expressing MEF Grn−/− (KOTH). The new KOTH lines stably expressing PGRN (KO-PGRN) and GRN2L3 (KO-GRN2) were maintained in DMEM plus 10% hi-FBS, 2 μg/mL puromycin and 200 μg/mL Hygromycin B and subjected to clonal enrichment. Isolated MEF cell lines were analyzed for expression of TMEM192–3xHA, PGRN, granulins by western blot The lines with high expression levels were chosen, expanded, and frozen.
Fluorescent immunocytochemistry
Triple-label fluorescent immunocytochemistry was performed to visualize lysosomal and mitochondrial co-localization of GRNs in PGRN, GRN2, GRN4-expressing TMEM192×3HA Grn−/− MEF cells with lysosomal marker (CTSD), and a mitochondrial marker (HSP60). Cells were cultured as described above in growth medium and plated on Poly-L-Lysine coated 12mm coverglass in 24 well plates. Cells were washed twice with dPBS and fixed with 4% Paraformaldehyde for 20minutes at room temperature (RT). Proceeded with 3 times dPBS wash, and permeabilized with 0.1% Triton dPBS for 15 min at RT. Then, it was blocked with 5% normal donkey serum for 30 min and followed by incubation with optimal dilutions of antibodies mixture at 4◦ overnight with shaking. After three washes (10 min each) in dPBS, cells were incubated with optimal concentrations of fluorescent-labeled secondary antibodies and DAPI (1ug/ml) mixture for an hour. Bound primary antibodies were detected with Alexa Fluor 488 donkey anti-chicken IgG, Alexa Fluor 568-donkey anti-goat IgG, and Cy5-donkey anti-rabbit IgG. After three washes, sections were mounted, coverslipped with Immuno-mount fluorescent mounting media (Thermo Fisher) and imaged using Lecia STELLARIS SP8 microscope with a DFC9000 GT camera and system software (LAS X Life Science microscope software). 5 different regions of interests were imaged and analyzed using an automated pipeline created using CellProfiler (www.cellprofiler.org)85 for quantification.
Cell homogenization, Lyso-IP, and immunoblotting
Two 15 cm plates for each of the five lines stably expressing TMEM192_3xHA were seeded with 3 million cells in growth medium and grown for 24 h. Cells were washed twice with PBS, then gently scrapped with PBS/citric saline (135 mM KCl, 15 mM sodium citrate), after citric saline pre-treatment (1 min at 37°C), and spun at 1,000 xg for 1 min at 4°C. Pelleted cells were resuspended in 950 μL homogenization buffer (50 mM MES pH 6.5, 90 mM KCL, 6 mM magnesium acetate, 1× Halt protease and phosphatase inhibitor cocktail, 1 μL/mL endonuclease Denarase (c-LEcta GmbH).89 Cells were then loaded into 1-cc syringes through 20-gauge needles and slowly passed through a 16-μm gap in a cell homogenizer (Isobiotec) once in one direction, with uniform manual pressure. Proceeded to Lyso-IP as described by Abu-Remaileh et al., 2017 with modifications. 15 μL of the suspension was reserved for evaluation of cell homogenization quality by trypan blue exclusion, and the remainder centrifuged at 1,000 x g for 10 min at 4°C. The resulting pellet was reserved on ice for further protein extraction, while 90% of the light post-nuclear suspension (PNS), that contains mainly cytosol and small vesicles, was added to pre-washed anti-HA magnetic beads (ThermoFisher Scientific) and incubated on a MACmix rotator (Miltenyi Biotech) at room temperature (RT) for 5 min. Half of the remaining 10% of PNS was reserved on ice for immunoblotting, as Lyso-IP input. From here on all tubes used were low-retention tubes. The beads were gently rinsed by single resuspension in 1 mL of homogenization buffer and transferred to a new tube, three times. Beads were magnetically collected at the bottom of tube before the addition of 2 consecutive changes of lysis buffer (50 mM Tris pH 8.0, 150 mM NaCl, 1% Triton-Tx100, 2X Halt protease and phosphatase inhibitor cocktail) and incubated on ice for 10 min each time. Tubes were then placed on a magnetic rack and the supernatants were pooled into fresh tubes and kept on ice. Meanwhile, the remaining cytoplasmic/membrane proteins were extracted from the homogenate cell pellets to generate a cell lysate (C.L.). Pellets were resuspended in 950 μL of gentle lysis buffer (10 mM Tris pH 8.0, 15 mM NaCl, 5 mM magnesium acetate, plus 1× Halt protease and phosphatase inhibitor cocktail) and incubated on ice for 10 min. Triton Tx100 and CHAPS were added to 0.1% and 0.6% final concentrations, respectively, then tubes were inverted ten times before centrifugation at 1,000 x g at 4°C for 5 min. Supernatants were transferred to fresh tubes and pelleted nuclei were frozen. All supernatants were aliquoted and stored at −80°C for later use. Subsequently, an aliquot of each supernatant (cell lysate, input, and Lyso-IP samples) was thawed on ice and protein concentration was measured using Pierce BCA Protein Assay (ThermoFisher Scientific). SDS-PAGE samples normalized for protein concentration were made, reduced, and denatured, then loaded into 10% BisTris/MES NuPAGE gels (ThermoFisher Scientific) run and transferred to 0.22 μm-nitrocellulose membranes with a Transblot Turbo apparatus (Bio-Rad). Blots were then blocked for 1 h at RT, sectioned, incubated in primary antibodies at 4°C overnight and in secondary antibodies for 1 h at RT. Blot images were acquired on either an Odyssey Fc (ECL) or Odyssey M scanner (Li-Cor Biotechnology) and analyzed using Image Studio software (Li-Cor Biotechnology).
Flash frozen mouse brain sample processing for immunoblot
To prepare samples for the immunoblot analysis of proteins, a novel protocol was developed in which approximately 40 mg of mouse hippocampal tissue from each sample was placed in a solution of PBS with added HALT phosphatase protease inhibitor (PPI) at a dilution of 1:2 (weight to volume). The PPI was diluted into the 1xPBS at 1:100. In the PBS + PPI solution, the sample was cut into smaller pieces with mini scissors. Once cut into smaller pieces, the sample is ready for further homogenization.
A bead lysis kit was used for the homogenization of these small, soft hippocampal samples. The samples were cut into pieces and, still in the PBS + PPI solution, pipetted into 1.5 mL RINO screw-tap tubes (Next Advance) prefilled with zirconium oxide beads. Tubes were placed into the Bullet Blender (Next Advance) for homogenization.
Once homogenized, the solution was diluted 1:5 in RIPA lysis buffer supplemented with 1x HALT protease and phosphatase inhibitor. After 15 min, the solution was sonicated (30A; 2 s on; 8 s of rest; 10 s total sonication time/sample). After sonication, the solution was spun down in a centrifuge at 20,000xRCF at 4C for 10 min. Protein concentration was measured with the bicinchoninic acid (BCA) assay, samples were frozen in aliquots at −80C.
Immunoblot
SDS/PAGE and immunoblotting of HeLa cell lysates, cell media, and mouse brain lysates were performed as described.26,84,96 Mouse brain running samples were prepared for immunoblot in 1X Laemmli loading buffer with 20 mM tris(2-carboxyethyl)phosphine (TCEP)) followed by denaturation at 70°C for 15 min. For immunoblotting, protein samples were first separated on Bio-Rad TGX 4–20% 26-well gels at 100 V and transferred to a 0.2-μm nitrocellulose membrane using the Bio-Rad Trans-blot Turbo system. After BulletBlock (Nacalai) for 30 min at room temperature, membranes were incubated overnight at 4°C with primary antibodies (STAR MATERIALS). Membranes were probed with anti-Histone H3 or anti-Beta tubulin antibodies and imaged on the Odyssey Fc (LI-COR), to normalize protein abundance between samples.
For hGRN2 and hGRN4 protein samples were separated using 4–20% BisTris gels run using MES buffer (Genscript) at 100V to resolve bands. Transfers were completed using Bio-Rad Trans-blot Turbo to a 0.2-μm nitrocellulose membrane, then blocked with Fish Serum Blocking Buffer (ThermoFisher) for 60 min at room temperature. Membranes were then incubated with primary antibodies (1 μg/mL) overnight at 4C. All primary antibodies were diluted to a final concentration of 50% glycerol for long term storage at −20C. Near-infrared fluorescent secondary antibodies (diluted in TBST) or HRP-conjugated (diluted in 0.5% milk in TBST) antibodies (STAR Materials) were incubated for 1 h at room temperature. For HRP visualization, blots were incubated in Chemi-Lumi One Super (Nacalai) or SuperSignal West Femto (Thermo) for 5 min before imaging. Near infrared or chemiluminescent blots were imaged using Odyssey Fc (LI-COR) and analyzed by Image Studio software 5.2 (LI-COR).
Protein alignment and percent identity
Granulin 1–7 amino acid sequences were accessed from Uniprot Human: P28799). Sequences were aligned using the msa R package with ClustalOmega.97 Alignments were visualized and consensus sequence calculated using ggmsa.98 Percent Identity of amino acids was calculated from the ClustalOmega hGRN alignment using Bio3D.87,88,90
| Granulin | UniProt Accession number |
|---|---|
|
| |
| hGRN1 (G) | PRO_0000012695 |
| hGRN2 (F) | PRO_0000012696 |
| hGRN3 (B) | PRO_0000012697 |
| hGRN4 (A) | PRO_0000012698 |
| hGRN5 (C) | PRO_0000012699 |
| hGRN6 (D) | PRO_0000012700 |
| hGRN7 (E) | PRO_0000012701 |
Diagrams
Some diagrams were made using BioRender (biorender.com).
QUANTIFICATION AND STATISTICAL ANALYSIS
Proteomics, lipidomics, and metabolomics
LC/MS data was Log2 transformed and ANOVAs for the following comparisons were performed (GFP-Grn−/− and GFP-Grn+/+) (GFP-Grn−/− and hPGRN-Grn−/−) (GFP-Grn−/− and hGRN2-Grn−/−) (GFP-Grn−/− and hGRN4-Grn−/−) p-values were adjusted using the Benjamini-Hochberg method. Abundance of individual proteins of interest were analyzed using One-Way ANOVA followed by Tukey’s post-hoc analysis. Variance was assessed using the Brown-Forsythe test, p = 0.05 and the normality of GFP Grn−/− and GFP-Grn+/+ samples was determined using the Shapiro-Wilk test p = 0.05. PCA confidence intervals were analyzed using the PCAtools R package, alpha set to 95%. The area ratios of endogenous lipids, metabolites, and surrogate internal standards were quantified using SCIEX OS 3.1. Statistical analysis of significance for lipid and metabolite levels in samples was determined by One-way ANOVA with Tukey’s post-hoc analysis. *p < 0.05, **p < 0.01, ***p < 0.001, ****p < 0.0001. (GFP-Grn−/− and GFP-Grn+/+) (GFP-Grn−/− and hPGRN-Grn−/−) (GFP-Grn−/− and hGRN2-Grn−/−) (GFP-Grn−/− and hGRN4-Grn−/−) comparisons are visualized in figures.
Immunohistochemistry and lipofuscin
IHC image quantification was performed single brain sections from 5 animals per group (n = 5), except for lipofuscin accumulation which was quantified from a single brain section from 9 to 13 animals per group (n = 9–13). Normality of GFP Grn−/− and GFP-Grn+/+ samples was assessed using Shapiro-Wilk test p = 0.05 and variance was assessed using Brown-Forsythe test p = 0.05. Comparisons were conducted using two-way ANOVA, one factor being brain region and the second being AAV treatment group. A full effect model was fit and Tukey’s post-hoc analysis was completed comparing treatments groups to all other treatment groups within brain region.
Fluorescent immunocytochemistry
FICC image quantification was performed in 5 different regions of interest across 2 different coverslips per group in hGRNs-Grn−/− MEF cells. Images were obtained by Leica SP8 Stellaris microscope with LAS X software and co-localization was assessed by Pearson’s correlation co-efficiency in CellProfiler software. Comparisons were conducted using two-way ANOVA, one factor being the different organelle markers and the second being the transduction group.
Western Blot and ELISA quantification
All blots were run using 5 individual animals per group (n = 5) and normalized values were analyzed using One-Way ANOVA followed by Tukey’s post-hoc analysis. Variance nd normality were assessed in the same manner as immunohistochemistry experiments. All regions were assessed independently. The hippocampal galectin-3 outlier was identified using Grubbs test p = 0.0001. ELISA data was analyzed using One-Way ANOVA followed by Tukey’s post-hoc test.
Visualization
All bar charts were produced in PRISM version 9 and heatmaps were made using Quickomics.91
Supplementary Material
Highlights.
Grn−/− mouse brain proteomics reveals inflammation and defects in lipids and lysosomes
Expression of granulins using AAV ameliorates dysregulation of the thalamic proteome
Granulins correct lysosome defects, inflammation, and lipofuscin in Grn−/− mouse brain
Granulins localize to lysosomes in Grn−/− brain and fibroblasts, likely mediating activity
ACKNOWLEDGMENTS
We thank the Emory Center for Neurodegenerative Disease and the Neuroscience graduate program for support and helpful comments. We thank Dr. Shawn Ferguson and Dr. Robert Farese for the gift of HeLa and MEF GRN−/− cells. We thank Dr. Yona Levites and Dr. Todd Golde for producing AAV. We thank Dr. Nicholas Seyfried, Duc Duong, and the Emory Proteomics core for analytical services and expertise. This work was supported by NIH/NCI (P30CA138292), NIH/NINDS R01NS105971, NIH/NIA RF1AG079318, New Vision Research Investigator Award, the Alzheimer’s Drug Discovery Foundation and the Association for Frontotemporal Degeneration, the Bluefield Project to Cure Frontotemporal Dementia, the BrightFocus Foundation, Arkuda Therapeutics, and an Emory School of Medicine Dean’s I3 WOW grant. J.R. was supported by an NIH/NINDS F31 Ruth L. Kirschstein National Research Service Award fellowship grant (F31NS117129).
Footnotes
DECLARATION OF INTERESTS
C.H., B.M.T., G.A., and J.-F.B. are employees of Arkuda Therapeutics. C.H., G.T., and T.K are listed as inventors on a patent application related to this work that is titled “Methods to treat neurodegeneration with granulins.”
SUPPLEMENTAL INFORMATION
Supplemental information can be found online at https://doi.org/10.1016/j.celrep.2024.114985.
REFERENCES
- 1.Palfree RGE, Bennett HPJ, and Bateman A. (2015). The Evolution of the Secreted Regulatory Protein Progranulin. PLoS One 10, e0133749. 10.1371/journal.pone.0133749. [DOI] [PMC free article] [PubMed] [Google Scholar]
- 2.Baker M, Mackenzie IR, Pickering-Brown SM, Gass J, Rademakers R, Lindholm C, Snowden J, Adamson J, Sadovnick AD, Rollinson S, et al. (2006). Mutations in progranulin cause tau-negative frontotemporal dementia linked to chromosome 17. Nature 442, 916–919. http://www.nature.com/nature/journal/v442/n7105/suppinfo/nature05016_S1.html. [DOI] [PubMed] [Google Scholar]
- 3.Cruts M, Gijselinck I, van der Zee J, Engelborghs S, Wils H, Pirici D, Rademakers R, Vandenberghe R, Dermaut B, Martin J-J, et al. (2006). Null mutations in progranulin cause ubiquitin-positive frontotemporal dementia linked to chromosome 17q21. Nature 442, 920–924. http://www.nature.com/nature/journal/v442/n7105/suppinfo/nature05017_S1.html. [DOI] [PubMed] [Google Scholar]
- 4.Zhou X, Kukar T, and Rademakers R. (2021). Lysosomal Dysfunction and Other Pathomechanisms in FTLD: Evidence from Progranulin Genetics and Biology. Adv. Exp. Med. Biol. 1281, 219–242. 10.1007/978-3-030-51140-1_14. [DOI] [PMC free article] [PubMed] [Google Scholar]
- 5.Smith KR, Damiano J, Franceschetti S, Carpenter S, Canafoglia L, Morbin M, Rossi G, Pareyson D, Mole SE, Staropoli JF, et al. (2012). Strikingly different clinicopathological phenotypes determined by progranulin-mutation dosage. Am. J. Hum. Genet. 90, 1102–1107. 10.1016/j.ajhg.2012.04.021. [DOI] [PMC free article] [PubMed] [Google Scholar]
- 6.Huin V, Barbier M, Bottani A, Lobrinus JA, Clot F, Lamari F, Chat L, Rucheton B, Fluchère F, Auvin S, et al. (2020). Homozygous GRN mutations: new phenotypes and new insights into pathological and molecular mechanisms. Brain 143, 303–319. 10.1093/brain/awz377. [DOI] [PubMed] [Google Scholar]
- 7.Xu H-M, Tan L, Wan Y, Tan M-S, Zhang W, Zheng Z-J, Kong L-L, Wang Z-X, Jiang T, Tan L, and Yu J-T (2017). PGRN Is Associated with Late-Onset Alzheimer’s Disease: a Case–Control Replication Study and Meta-analysis. Mol. Neurobiol. 54, 1187–1195. 10.1007/s12035-016-9698-4. [DOI] [PubMed] [Google Scholar]
- 8.Sheng J, Su L, Xu Z, and Chen G. (2014). Progranulin polymorphism rs5848 is associated with increased risk of Alzheimer’s disease. Gene 542, 141–145. 10.1016/j.gene.2014.03.041. [DOI] [PubMed] [Google Scholar]
- 9.Lee MJ, Chen TF, Cheng TW, and Chiu MJ (2011). rs5848 variant of progranulin gene is a risk of Alzheimer’s disease in the Taiwanese population. Neurodegener. Dis. 8, 216–220. 10.1159/000322538. [DOI] [PubMed] [Google Scholar]
- 10.Katsumata Y, Shade LM, Hohman TJ, Schneider JA, Bennett DA, Farfel JM, Alzheimer’s Disease Genetics Consortium; Kukull WA, Fardo DW, and Nelson PT (2022). Multiple gene variants linked to Alzheimer’s-type clinical dementia via GWAS are also associated with non-Alzheimer’s neuropathologic entities. Neurobiol. Dis. 174, 105880. 10.1016/j.nbd.2022.105880. [DOI] [PMC free article] [PubMed] [Google Scholar]
- 11.Rhinn H, Tatton N, McCaughey S, Kurnellas M, and Rosenthal A. (2022). Progranulin as a therapeutic target in neurodegenerative diseases. Trends Pharmacol. Sci. 43, 641–652. 10.1016/j.tips.2021.11.015. [DOI] [PubMed] [Google Scholar]
- 12.Simon MJ, Logan T, DeVos SL, and Di Paolo G. (2023). Lysosomal functions of progranulin and implications for treatment of frontotemporal dementia. Trends Cell Biol. 33, 324–339. 10.1016/j.tcb.2022.09.006. [DOI] [PubMed] [Google Scholar]
- 13.Zhang Y, Sloan SA, Clarke LE, Caneda C, Plaza CA, Blumenthal PD, Vogel H, Steinberg GK, Edwards MSB, Li G, et al. (2016). Purification and Characterization of Progenitor and Mature Human Astrocytes Reveals Transcriptional and Functional Differences with Mouse. Neuron 89, 37–53. 10.1016/j.neuron.2015.11.013. [DOI] [PMC free article] [PubMed] [Google Scholar]
- 14.Suh H-S, Choi N, Tarassishin L, and Lee SC (2012). Regulation of Progranulin Expression in Human Microglia and Proteolysis of Progranulin by Matrix Metalloproteinase-12 (MMP-12). PLoS One 7, e35115. 10.1371/journal.pone.0035115. [DOI] [PMC free article] [PubMed] [Google Scholar]
- 15.Uhlén M, Fagerberg L, Hallström BM, Lindskog C, Oksvold P, Mardinoglu A, Sivertsson Å, Kampf C, Sjöstedt E, Asplund A, et al. (2015). Proteomics. Tissue-based map of the human proteome. Science 347, 1260419. 10.1126/science.1260419. [DOI] [PubMed] [Google Scholar]
- 16.Ghag G, Holler CJ, Taylor G, Kukar TL, Uversky VN, and Rangachari V. (2017). Disulfide bonds and disorder in granulin-3: An unusual handshake between structural stability and plasticity. Protein Sci. 26, 1759–1772. 10.1002/pro.3212. [DOI] [PMC free article] [PubMed] [Google Scholar]
- 17.Zhu J, Nathan C, Jin W, Sim D, Ashcroft GS, Wahl SM, Lacomis L, Erdjument-Bromage H, Tempst P, Wright CD, and Ding A. (2002). Conversion of proepithelin to epithelins: roles of SLPI and elastase in host defense and wound repair. Cell 111, 867–878. [DOI] [PubMed] [Google Scholar]
- 18.Kessenbrock K, Fröhlich L, Sixt M, Lämmermann T, Pfister H, Bateman A, Belaaouaj A, Ring J, Ollert M, Fässler R, and Jenne DE (2008). Proteinase 3 and neutrophil elastase enhance inflammation in mice by inactivating antiinflammatory progranulin. J. Clin. Invest. 118, 2438–2447. 10.1172/jci34694. [DOI] [PMC free article] [PubMed] [Google Scholar]
- 19.Neill T, Buraschi S, Goyal A, Sharpe C, Natkanski E, Schaefer L, Morrione A, and Iozzo RV (2016). EphA2 is a functional receptor for the growth factor progranulin. J. Cell Biol. 215, 687–703. 10.1083/jcb.201603079. [DOI] [PMC free article] [PubMed] [Google Scholar]
- 20.Chen X, Chang J, Deng Q, Xu J, Nguyen TA, Martens LH, Cenik B, Taylor G, Hudson KF, Chung J, et al. (2013). Progranulin does not bind tumor necrosis factor (TNF) receptors and is not a direct regulator of TNF-dependent signaling or bioactivity in immune or neuronal cells. J. Neurosci. 33, 9202–9213. 10.1523/JNEUROSCI.5336-12.2013. [DOI] [PMC free article] [PubMed] [Google Scholar]
- 21.Etemadi N, Webb A, Bankovacki A, Silke J, and Nachbur U. (2013). Progranulin does not inhibit TNF and lymphotoxin-α signalling through TNF receptor 1. Immunol. Cell Biol. 91, 661–664. 10.1038/icb.2013.53. [DOI] [PubMed] [Google Scholar]
- 22.Lang I, Füllsack S, and Wajant H. (2018). Lack of Evidence for a Direct Interaction of Progranulin and Tumor Necrosis Factor Receptor-1 and Tumor Necrosis Factor Receptor-2 From Cellular Binding Studies. Front. Immunol. 9, 793. 10.3389/fimmu.2018.00793. [DOI] [PMC free article] [PubMed] [Google Scholar]
- 23.De Muynck L, Herdewyn S, Beel S, Scheveneels W, Van Den Bosch L, Robberecht W, and Van Damme P. (2013). The neurotrophic properties of progranulin depend on the granulin E domain but do not require sortilin binding. Neurobiol. Aging 34, 2541–2547. 10.1016/j.neurobiolaging.2013.04.022. [DOI] [PubMed] [Google Scholar]
- 24.Salazar DA, Butler VJ, Argouarch AR, Hsu T-Y, Mason A, Nakamura A, McCurdy H, Cox D, Ng R, Pan G, et al. (2015). The Progranulin Cleavage Products, Granulins, Exacerbate TDP-43 Toxicity and Increase TDP-43 Levels. J. Neurosci. 35, 9315–9328. 10.1523/jneurosci.4808-14.2015. [DOI] [PMC free article] [PubMed] [Google Scholar]
- 25.Butler VJ, Gao F, Corrales CI, Cortopassi WA, Caballero B, Vohra M, Ashrafi K, Cuervo AM, Jacobson MP, Coppola G, and Kao AW (2019). Age- and stress-associated C. elegans granulins impair lysosomal function and induce a compensatory HLH-30/TFEB transcriptional response. PLoS Genet. 15, e1008295. 10.1371/journal.pgen.1008295. [DOI] [PMC free article] [PubMed] [Google Scholar]
- 26.Holler CJ, Taylor G, Deng Q, and Kukar T. (2017). Intracellular Proteolysis of Progranulin Generates Stable, Lysosomal Granulins that Are Haploinsufficient in Patients with Frontotemporal Dementia Caused by GRN Mutations. eNeuro 4, ENEURO.0100–17.2017. 10.1523/ENEURO.0100-17.2017. [DOI] [PMC free article] [PubMed] [Google Scholar]
- 27.Lee CW, Stankowski JN, Chew J, Cook CN, Lam Y-W, Almeida S, Carlomagno Y, Lau K-F, Prudencio M, Gao F-B, et al. (2017). The lysosomal protein cathepsin L is a progranulin protease. Mol. Neurodegener. 12, 55. 10.1186/s13024-017-0196-6. [DOI] [PMC free article] [PubMed] [Google Scholar]
- 28.Zhou X, Paushter DH, Feng T, Sun L, Reinheckel T, and Hu F. (2017). Lysosomal processing of progranulin. Mol. Neurodegener. 12, 62. 10.1186/s13024-017-0205-9. [DOI] [PMC free article] [PubMed] [Google Scholar]
- 29.Darmoise A, Maschmeyer P, and Winau F. (2010). The immunological functions of saposins. Adv. Immunol. 105, 25–62. 10.1016/s0065-2776(10)05002-9. [DOI] [PMC free article] [PubMed] [Google Scholar]
- 30.Ghoshal N, Dearborn JT, Wozniak DF, and Cairns NJ (2012). Core features of frontotemporal dementia recapitulated in progranulin knockout mice. Neurobiol. Dis. 45, 395–408. 10.1016/j.nbd.2011.08.029. [DOI] [PMC free article] [PubMed] [Google Scholar]
- 31.Yin F, Dumont M, Banerjee R, Ma Y, Li H, Lin MT, Beal MF, Nathan C, Thomas B, and Ding A. (2010). Behavioral deficits and progressive neuropathology in progranulin-deficient mice: a mouse model of frontotemporal dementia. Faseb. J. 24, 4639–4647. 10.1096/fj.10-161471. [DOI] [PMC free article] [PubMed] [Google Scholar]
- 32.Lui H, Zhang J, Makinson SR, Cahill MK, Kelley KW, Huang HY, Shang Y, Oldham MC, Martens LH, Gao F, et al. (2016). Progranulin Deficiency Promotes Circuit-Specific Synaptic Pruning by Microglia via Complement Activation. Cell 165, 921–935. 10.1016/j.cell.2016.04.001. [DOI] [PMC free article] [PubMed] [Google Scholar]
- 33.Tanaka Y, Matsuwaki T, Yamanouchi K, and Nishihara M. (2013). Increased lysosomal biogenesis in activated microglia and exacerbated neuronal damage after traumatic brain injury in progranulin-deficient mice. Neuroscience 250, 8–19. 10.1016/j.neuroscience.2013.06.049. [DOI] [PubMed] [Google Scholar]
- 34.Feng T, Mai S, Roscoe JM, Sheng RR, Ullah M, Zhang J, Katz II, Yu H, Xiong W, and Hu F. (2020). Loss of TMEM106B and PGRN leads to severe lysosomal abnormalities and neurodegeneration in mice. EMBO Rep. 21, e50219. 10.15252/embr.202050219. [DOI] [PMC free article] [PubMed] [Google Scholar]
- 35.Ahmed Z, Sheng H, Xu Y. f., Lin W-L, Innes AE, Gass J, Yu X, Wuertzer CA, Hou H, Chiba S, et al. (2010). Accelerated Lipofuscinosis and Ubiquitination in Granulin Knockout Mice Suggest a Role for Progranulin in Successful Aging. Am. J. Pathol. 177, 311–324. 10.2353/ajpath.2010.090915. [DOI] [PMC free article] [PubMed] [Google Scholar]
- 36.Yin F, Banerjee R, Thomas B, Zhou P, Qian L, Jia T, Ma X, Ma Y, Iadecola C, Beal MF, et al. (2010). Exaggerated inflammation, impaired host defense, and neuropathology in progranulin-deficient mice. J. Exp. Med. 207, 117–128. 10.1084/jem.20091568. [DOI] [PMC free article] [PubMed] [Google Scholar]
- 37.Tolkatchev D, Malik S, Vinogradova A, Wang P, Chen Z, Xu P, Bennett HPJ, Bateman A, and Ni F. (2008). Structure dissection of human progranulin identifies well-folded granulin/epithelin modules with unique functional activities. Protein Sci. 17, 711–724. 10.1110/ps.073295308. [DOI] [PMC free article] [PubMed] [Google Scholar]
- 38.Staudt C, Puissant E, and Boonen M. (2016). Subcellular Trafficking of Mammalian Lysosomal Proteins: An Extended View. Int. J. Mol. Sci. 18, 47. 10.3390/ijms18010047. [DOI] [PMC free article] [PubMed] [Google Scholar]
- 39.Verbeeck C, Deng Q, Dejesus-Hernandez M, Taylor G, Ceballos-Diaz C, Kocerha J, Golde T, Das P, Rademakers R, Dickson DW, and Kukar T. (2012). Expression of Fused in sarcoma mutations in mice recapitulates the neuropathology of FUS proteinopathies and provides insight into disease pathogenesis. Mol. Neurodegener. 7, 53. 10.1186/1750-1326-7-53. [DOI] [PMC free article] [PubMed] [Google Scholar]
- 40.Chakrabarty P, Rosario A, Cruz P, Siemienski Z, Ceballos-Diaz C, Crosby K, Jansen K, Borchelt DR, Kim J-Y, Jankowsky JL, et al. (2013). Capsid Serotype and Timing of Injection Determines AAV Transduction in the Neonatal Mice Brain. PLoS One 8, e67680. 10.1371/journal.pone.0067680. [DOI] [PMC free article] [PubMed] [Google Scholar]
- 41.Kim JY, Grunke SD, Levites Y, Golde TE, and Jankowsky JL (2014). Intracerebroventricular viral injection of the neonatal mouse brain for persistent and widespread neuronal transduction. J. Vis. Exp. 51863, 51863. 10.3791/51863. [DOI] [PMC free article] [PubMed] [Google Scholar]
- 42.Huang M, Modeste E, Dammer E, Merino P, Taylor G, Duong DM, Deng Q, Holler CJ, Gearing M, Dickson D, et al. (2020). Network analysis of the progranulin-deficient mouse brain proteome reveals pathogenic mechanisms shared in human frontotemporal dementia caused by GRN mutations. Acta Neuropathol. Commun. 8, 163. 10.1186/s40478-020-01037-x. [DOI] [PMC free article] [PubMed] [Google Scholar]
- 43.Bocchetta M, Gordon E, Cardoso MJ, Modat M, Ourselin S, Warren JD, and Rohrer JD (2018). Thalamic atrophy in frontotemporal dementia - Not just a C9orf72 problem. Neuroimage. Clin. 18, 675–681. 10.1016/j.nicl.2018.02.019. [DOI] [PMC free article] [PubMed] [Google Scholar]
- 44.Bocchetta M, Todd EG, Peakman G, Cash DM, Convery RS, Russell LL, Thomas DL, Eugenio Iglesias J, van Swieten JC, Jiskoot LC, et al. (2021). Differential early subcortical involvement in genetic FTD within the GENFI cohort. Neuroimage. Clin. 30, 102646. 10.1016/j.nicl.2021.102646. [DOI] [PMC free article] [PubMed] [Google Scholar]
- 45.Kashyap SN, Boyle NR, and Roberson ED (2023). Preclinical Interventions in Mouse Models of Frontotemporal Dementia Due to Progranulin Mutations. Neurotherapeutics 20, 140–153. 10.1007/s13311-023-01348-6. [DOI] [PMC free article] [PubMed] [Google Scholar]
- 46.Allan ERO, Campden RI, Ewanchuk BW, Tailor P, Balce DR, McKenna NT, Greene CJ, Warren AL, Reinheckel T, and Yates RM (2017). A role for cathepsin Z in neuroinflammation provides mechanistic support for an epigenetic risk factor in multiple sclerosis. J. Neuroinflammation 14, 103. 10.1186/s12974-017-0874-x. [DOI] [PMC free article] [PubMed] [Google Scholar]
- 47.Brandenstein L, Schweizer M, Sedlacik J, Fiehler J, and Storch S. (2016). Lysosomal dysfunction and impaired autophagy in a novel mouse model deficient for the lysosomal membrane protein Cln7. Hum. Mol. Genet. 25, 777–791. 10.1093/hmg/ddv615. [DOI] [PubMed] [Google Scholar]
- 48.Thygesen C, Ilkjær L, Kempf SJ, Hemdrup AL, von Linstow CU, Babcock AA, Darvesh S, Larsen MR, and Finsen B. (2018). Diverse Protein Profiles in CNS Myeloid Cells and CNS Tissue From Lipopolysaccharide- and Vehicle-Injected APP(SWE)/PS1(DE9) Transgenic Mice Implicate Cathepsin Z in Alzheimer’s Disease. Front. Cell. Neurosci. 12, 397. 10.3389/fncel.2018.00397. [DOI] [PMC free article] [PubMed] [Google Scholar]
- 49.Aits S, Kricker J, Liu B, Ellegaard AM, Hämälistö S, Tvingsholm S, Corcelle-Termeau E, Høgh S, Farkas T, Holm Jonassen A, et al. (2015). Sensitive detection of lysosomal membrane permeabilization by lysosomal galectin puncta assay. Autophagy 11, 1408–1424. 10.1080/15548627.2015.1063871. [DOI] [PMC free article] [PubMed] [Google Scholar]
- 50.Jia J, Claude-Taupin A, Gu Y, Choi SW, Peters R, Bissa B, Mudd MH, Allers L, Pallikkuth S, Lidke KA, et al. (2020). MERIT, a cellular system coordinating lysosomal repair, removal and replacement. Autophagy 16, 1539–1541. 10.1080/15548627.2020.1779451. [DOI] [PMC free article] [PubMed] [Google Scholar]
- 51.Petkau TL, Neal SJ, Orban PC, MacDonald JL, Hill AM, Lu G, Feldman HH, Mackenzie IRA, and Leavitt BR (2010). Progranulin expression in the developing and adult murine brain. J. Comp. Neurol. 518, 3931–3947. 10.1002/cne.22430. [DOI] [PubMed] [Google Scholar]
- 52.Zhang J, Velmeshev D, Hashimoto K, Huang YH, Hofmann JW, Shi X, Chen J, Leidal AM, Dishart JG, Cahill MK, et al. (2020). Neurotoxic microglia promote TDP-43 proteinopathy in progranulin deficiency. Nature 588, 459–465. 10.1038/s41586-020-2709-7. [DOI] [PMC free article] [PubMed] [Google Scholar]
- 53.Galloway DA, Phillips AEM, Owen DRJ, and Moore CS (2019). Phagocytosis in the Brain: Homeostasis and Disease. Front. Immunol. 10, 790. 10.3389/fimmu.2019.00790. [DOI] [PMC free article] [PubMed] [Google Scholar]
- 54.Hopperton KE, Mohammad D, Trépanier MO, Giuliano V, and Bazinet RP (2018). Markers of microglia in post-mortem brain samples from patients with Alzheimer’s disease: a systematic review. Mol. Psychiatr. 23, 177–198. 10.1038/mp.2017.246. [DOI] [PMC free article] [PubMed] [Google Scholar]
- 55.Holness CL, da Silva RP, Fawcett J, Gordon S, and Simmons DL (1993). Macrosialin, a mouse macrophage-restricted glycoprotein, is a member of the lamp/lgp family. J. Biol. Chem. 268, 9661–9666. [PubMed] [Google Scholar]
- 56.Santos MN, Paushter DH, Zhang T, Wu X, Feng T, Lou J, Du H, Becker SM, Fragoza R, Yu H, and Hu F. (2022). Progranulin-derived granulin E and lysosome membrane protein CD68 interact to reciprocally regulate their protein homeostasis. J. Biol. Chem. 298, 102348. 10.1016/j.jbc.2022.102348. [DOI] [PMC free article] [PubMed] [Google Scholar]
- 57.Hüttenrauch M, Ogorek I, Klafki H, Otto M, Stadelmann C, Weggen S, Wiltfang J, and Wirths O. (2018). Glycoprotein NMB: a novel Alzheimer’s disease associated marker expressed in a subset of activated microglia. Acta Neuropathol. Commun. 6, 108. 10.1186/s40478-018-0612-3. [DOI] [PMC free article] [PubMed] [Google Scholar]
- 58.Moloney EB, Moskites A, Ferrari EJ, Isacson O, and Hallett PJ (2018). The glycoprotein GPNMB is selectively elevated in the substantia nigra of Parkinson’s disease patients and increases after lysosomal stress. Neurobiol. Dis. 120, 1–11. 10.1016/j.nbd.2018.08.013. [DOI] [PMC free article] [PubMed] [Google Scholar]
- 59.Gabriel TL, Tol MJ, Ottenhof R, van Roomen C, Aten J, Claessen N, Hooibrink B, de Weijer B, Serlie MJ, Argmann C, et al. (2014). Lysosomal stress in obese adipose tissue macrophages contributes to MITF-dependent Gpnmb induction. Diabetes 63, 3310–3323. 10.2337/db13-1720. [DOI] [PubMed] [Google Scholar]
- 60.Evers BM, Rodriguez-Navas C, Tesla RJ, Prange-Kiel J, Wasser CR, Yoo KS, McDonald J, Cenik B, Ravenscroft TA, Plattner F, et al. (2017). Lipidomic and Transcriptomic Basis of Lysosomal Dysfunction in Progranulin Deficiency. Cell Rep. 20, 2565–2574. 10.1016/j.celrep.2017.08.056. [DOI] [PMC free article] [PubMed] [Google Scholar]
- 61.Khrouf W, Saracino D, Rucheton B, Houot M, Clot F, Rinaldi D, Vitor J, Huynh M, Heng E, Schlemmer D, et al. (2023). Plasma lysosphingolipids in GRN-related diseases: Monitoring lysosomal dysfunction to track disease progression. Neurobiol. Dis. 181, 106108. 10.1016/j.nbd.2023.106108. [DOI] [PubMed] [Google Scholar]
- 62.Marian OC, Teo JD, Lee JY, Song H, Kwok JB, Landin-Romero R, Halliday G, and Don AS (2023). Disrupted myelin lipid metabolism differentiates frontotemporal dementia caused by GRN and C9orf72 gene mutations. Acta Neuropathol. Commun. 11, 52. 10.1186/s40478-023-01544-7. [DOI] [PMC free article] [PubMed] [Google Scholar]
- 63.Logan T, Simon MJ, Rana A, Cherf GM, Srivastava A, Davis SS, Low RLY, Chiu C-L, Fang M, Huang F, et al. (2021). Rescue of a lysosomal storage disorder caused by Grn loss of function with a brain penetrant progranulin biologic. Cell 184, 4651–4668.e25. 10.1016/j.cell.2021.08.002. [DOI] [PMC free article] [PubMed] [Google Scholar]
- 64.Boland S, Swarup S, Ambaw YA, Malia PC, Richards RC, Fischer AW, Singh S, Aggarwal G, Spina S, Nana AL, et al. (2022). Deficiency of the frontotemporal dementia gene GRN results in gangliosidosis. Nat. Commun. 13, 5924. 10.1038/s41467-022-33500-9. [DOI] [PMC free article] [PubMed] [Google Scholar]
- 65.Prinetti A, Prioni S, Chiricozzi E, Schuchman EH, Chigorno V, and Sonnino S. (2011). Secondary alterations of sphingolipid metabolism in lysosomal storage diseases. Neurochem. Res. 36, 1654–1668. 10.1007/s11064-010-0380-3. [DOI] [PubMed] [Google Scholar]
- 66.Breiden B, and Sandhoff K. (2019). Lysosomal Glycosphingolipid Storage Diseases. Annu. Rev. Biochem. 88, 461–485. 10.1146/annurev-biochem-013118-111518. [DOI] [PubMed] [Google Scholar]
- 67.Ward ME, Chen R, Huang H-Y, Ludwig C, Telpoukhovskaia M, Taubes A, Boudin H, Minami SS, Reichert M, Albrecht P, et al. (2017). Individuals with progranulin haploinsufficiency exhibit features of neuronal ceroid lipofuscinosis. Sci. Transl. Med. 9, eaah5642. 10.1126/scitranslmed.aah5642. [DOI] [PMC free article] [PubMed] [Google Scholar]
- 68.Arrant AE, Onyilo VC, Unger DE, and Roberson ED (2018). Progranulin Gene Therapy Improves Lysosomal Dysfunction and Microglial Pathology Associated with Frontotemporal Dementia and Neuronal Ceroid Lipofuscinosis. J. Neurosci. 38, 2341–2358. 10.1523/jneurosci.3081-17.2018. [DOI] [PMC free article] [PubMed] [Google Scholar]
- 69.Barral DC, Staiano L, Guimas Almeida C, Cutler DF, Eden ER, Futter CE, Galione A, Marques ARA, Medina DL, Napolitano G, et al. (2022). Current methods to analyze lysosome morphology, positioning, motility and function. Traffic 23, 238–269. 10.1111/tra.12839. [DOI] [PMC free article] [PubMed] [Google Scholar]
- 70.Cheng XT, Xie YX, Zhou B, Huang N, Farfel-Becker T, and Sheng ZH (2018). Characterization of LAMP1-labeled nondegradative lysosomal and endocytic compartments in neurons. J. Cell Biol. 217, 3127–3139. 10.1083/jcb.201711083. [DOI] [PMC free article] [PubMed] [Google Scholar]
- 71.Abu-Remaileh M, Wyant GA, Kim C, Laqtom NN, Abbasi M, Chan SH, Freinkman E, and Sabatini DM (2017). Lysosomal metabolomics reveals V-ATPase- and mTOR-dependent regulation of amino acid efflux from lysosomes. Science 358, 807–813. 10.1126/science.aan6298. [DOI] [PMC free article] [PubMed] [Google Scholar]
- 72.Holler C, Taylor G, and Kukar T. (2016). Production, Detection, and Characterization of Proganulin (PGRN) and Granulins (GRNs) (held in Munich, Germany: Journal of Neurochemistry), p. 416. 138, 416. [Google Scholar]
- 73.Root J, Merino P, Nuckols A, Johnson M, and Kukar T. (2021). Lysosome dysfunction as a cause of neurodegenerative diseases: Lessons from frontotemporal dementia and amyotrophic lateral sclerosis. Neurobiol. Dis. 154, 105360. 10.1016/j.nbd.2021.105360. [DOI] [PMC free article] [PubMed] [Google Scholar]
- 74.Zhang L, Sheng R, and Qin Z. (2009). The lysosome and neurodegenerative diseases. Acta Biochim. Biophys. Sin. 41, 437–445. 10.1093/abbs/gmp031. [DOI] [PubMed] [Google Scholar]
- 75.Lie PPY, and Nixon RA (2019). Lysosome trafficking and signaling in health and neurodegenerative diseases. Neurobiol. Dis. 122, 94–105. 10.1016/j.nbd.2018.05.015. [DOI] [PMC free article] [PubMed] [Google Scholar]
- 76.Hinderer C, Miller R, Dyer C, Johansson J, Bell P, Buza E, and Wilson JM (2020). Adeno-associated virus serotype 1-based gene therapy for FTD caused by GRN mutations. Ann. Clin. Transl. Neurol. 7, 1843–1853. 10.1002/acn3.51165. [DOI] [PMC free article] [PubMed] [Google Scholar]
- 77.Peng X, Lanter JC, Y-P Chen A, Brand MA, Wozniak MK, Hoekman S, Longin O, Regeling H, Zonneveld W, P L Bell R, et al. (2023). Discovery of oxazoline enhancers of cellular progranulin release. Bioorg. Med. Chem. Lett. 80, 129048. 10.1016/j.bmcl.2022.129048. [DOI] [PubMed] [Google Scholar]
- 78.Miyakawa S, Sakuma H, Warude D, Asanuma S, Arimura N, Yoshihara T, Tavares D, Hata A, Ida K, Hori Y, et al. (2020). Anti-sortilin1 Antibody Up-Regulates Progranulin via Sortilin1 Down-Regulation. Front. Neurosci. 14, 586107. 10.3389/fnins.2020.586107. [DOI] [PMC free article] [PubMed] [Google Scholar]
- 79.Blain J-F, Chen AY, Brand MA, Lanter JC, Holler CJ, Brendel JK, Koenig G, Burnett DA, and Hurst RS (2022). A Novel In Vivo-Active Small Molecule Inducer of Progranulin for the Treatment of Frontotemporal Dementia. Alzheimer’s Dementia 18, e061924. 10.1002/alz.061924. [DOI] [Google Scholar]
- 80.Showalter MR, Berg AL, Nagourney A, Heil H, Carraway KL 3rd, and Fiehn O. (2020). The Emerging and Diverse Roles of Bis(monoacylglycero) Phosphate Lipids in Cellular Physiology and Disease. Int. J. Mol. Sci. 21, 8067. 10.3390/ijms21218067. [DOI] [PMC free article] [PubMed] [Google Scholar]
- 81.Zhang T, Du H, Santos MN, Wu X, Pagan MD, Trigiani LJ, Nishimura N, Reinheckel T, and Hu F. (2022). Differential regulation of progranulin derived granulin peptides. Mol. Neurodegener. 17, 15. 10.1186/s13024-021-00513-9. [DOI] [PMC free article] [PubMed] [Google Scholar]
- 82.Zhou X, Sun L, Bastos de Oliveira F, Qi X, Brown WJ, Smolka MB, Sun Y, and Hu F. (2015). Prosaposin facilitates sortilin-independent lysosomal trafficking of progranulin. J. Cell Biol. 210, 991–1002. 10.1083/jcb.201502029. [DOI] [PMC free article] [PubMed] [Google Scholar]
- 83.Hu F, Padukkavidana T, Vægter CB, Brady OA, Zheng Y, Mackenzie IR, Feldman HH, Nykjaer A, and Strittmatter SM (2010). Sortilin-mediated endocytosis determines levels of the frontotemporal dementia protein, progranulin. Neuron 68, 654–667. 10.1016/j.neuron.2010.09.034. [DOI] [PMC free article] [PubMed] [Google Scholar]
- 84.Johnson MA, Nuckols TA, Merino P, Bagchi P, Nandy S, Root J, Taylor G, Seyfried NT, and Kukar T. (2022). Proximity-based labeling reveals DNA damage-induced phosphorylation of fused in sarcoma (FUS) causes distinct changes in the FUS protein interactome. J. Biol. Chem. 298, 102135. 10.1016/j.jbc.2022.102135. [DOI] [PMC free article] [PubMed] [Google Scholar]
- 85.Lamprecht MR, Sabatini DM, and Carpenter AE (2007). CellProfiler: free, versatile software for automated biological image analysis. Biotechniques 42, 71–75. 10.2144/000112257. [DOI] [PubMed] [Google Scholar]
- 86.Blighe K, L.A. (2022). PCAtools: PCAtools: Everything Principal Components Analysis. R package version 2.10.0. [Google Scholar]
- 87.Trifinopoulos J, Nguyen LT, von Haeseler A, and Minh BQ (2016). W-IQ-TREE: a fast online phylogenetic tool for maximum likelihood analysis. Nucleic Acids Res. 44, W232–W235. 10.1093/nar/gkw256. [DOI] [PMC free article] [PubMed] [Google Scholar]
- 88.Kalyaanamoorthy S, Minh BQ, Wong TKF, von Haeseler A, and Jermiin LS (2017). ModelFinder: fast model selection for accurate phylogenetic estimates. Nat. Methods 14, 587–589. 10.1038/nmeth.4285. [DOI] [PMC free article] [PubMed] [Google Scholar]
- 89.Walker MW, and Lloyd-Evans E. (2015). A rapid method for the preparation of ultrapure, functional lysosomes using functionalized superparamagnetic iron oxide nanoparticles. Methods Cell Biol. 126, 21–43. 10.1016/bs.mcb.2014.10.019. [DOI] [PubMed] [Google Scholar]
- 90.Grant BJ, Rodrigues APC, ElSawy KM, McCammon JA, and Caves LSD (2006). Bio3d: an R package for the comparative analysis of protein structures. Bioinformatics 22, 2695–2696. 10.1093/bioinformatics/btl461. [DOI] [PubMed] [Google Scholar]
- 91.Gao B, Zhu J, Negi S, Zhang X, Gyoneva S, Casey F, Wei R, and Zhang B. (2021). Quickomics: exploring omics data in an intuitive, interactive and informative manner. Bioinformatics 37, 3670–3672. 10.1093/bioinformatics/btab255. [DOI] [PubMed] [Google Scholar]
- 92.(2020). Henrietta Lacks: science must right a historical wrong. Nature 585, 7. 10.1038/d41586-020-02494-z. [DOI] [PubMed] [Google Scholar]
- 93.Shah K, McCormack CE, and Bradbury NA (2014). Do you know the sex of your cells? Am. J. Physiol. Cell Physiol. 306, C3–C18. 10.1152/ajpcell.00281.2013. [DOI] [PMC free article] [PubMed] [Google Scholar]
- 94.Wickham H. (2016). ggplot2: Elegant Graphics for Data Analysis (Springer International Publishing; ). [Google Scholar]
- 95.Zhou Y, Zhou B, Pache L, Chang M, Khodabakhshi AH, Tanaseichuk O, Benner C, and Chanda SK (2019). Metascape provides a biologist-oriented resource for the analysis of systems-level datasets. Nat. Commun. 10, 1523. 10.1038/s41467-019-09234-6. [DOI] [PMC free article] [PubMed] [Google Scholar]
- 96.Johnson MA, Deng Q, Taylor G, McEachin ZT, Chan AWS, Root J, Bassell GJ, and Kukar T. (2020). Divergent FUS phosphorylation in primate and mouse cells following double-strand DNA damage. Neurobiol. Dis. 146, 105085. 10.1016/j.nbd.2020.105085. [DOI] [PMC free article] [PubMed] [Google Scholar]
- 97.Bodenhofer U, Bonatesta E, Horejš-Kainrath C, and Hochreiter S. (2015). msa: an R package for multiple sequence alignment. Bioinformatics 31, 3997–3999. 10.1093/bioinformatics/btv494. [DOI] [PubMed] [Google Scholar]
- 98.Zhou L, Feng T, Xu S, Gao F, Lam TT, Wang Q, Wu T, Huang H, Zhan L, Li L, et al. (2022). ggmsa: a visual exploration tool for multiple sequence alignment and associated data. Briefings Bioinf. 23, bbac222. 10.1093/bib/bbac222. [DOI] [PubMed] [Google Scholar]
Associated Data
This section collects any data citations, data availability statements, or supplementary materials included in this article.
Supplementary Materials
Data Availability Statement
Proteomic data are publicly available and deposited to the ProteomeXchange Consortium via the PRIDE repository (http://www.ebi.ac.uk/pride/archive/projects/PXD041095).
Metabolomic and lipidomic data are publicly available and deposited at Dataverse (https://doi.org/10.15139/S3/7Z2SVL).
No original code was produced, and all scripts and packages used to analyze data have been included in the key resources table.
KEY RESOURCES TABLE.
| REAGENT or RESOURCE | SOURCE | IDENTIFIER |
|---|---|---|
|
| ||
| Antibodies | ||
|
| ||
| Goat polyclonal anti-human progranulin | R and D Systems | Cat# AF2420; RRID: AB_2114489 |
| Rabbit polyclonal anti-human granulin 2 | This paper | N/A |
| Rabbit polyclonal anti-human granulin 4 | This paper | N/A |
| Goat polyclonal anti-mouse galectin-3 | R and D Systems | Cat# AF1197; RRID: AB_2234687 |
| Goat polyclonal anti-mouse cathepsin Z | Thermo Fisher Scientific | PA5–47048; RRID: AB_2576470 |
| Rabbit monoclonal anti-mouse CD68 | Cell Signaling Technology | Cat# 97778; RRID: AB_2928056 |
| Goat polyclonal anti-GFP | Rockland | Cat# 600–101-215; RRID: AB_218182 |
| Rabbit polyclonal anti-Beta Tubulin | Cell Signaling Technology | Cat#2146; RRID: AB_2210545 |
| Rabbit recombinant monoclonal Histone H3 | Cell Signaling Technology | Cat#4499; RRID: AB_10544537 |
| Chicken anti-MAP2 | Neuromics | Cat# CH22103; RRID: AB_2314763 |
| Goat polyclonal anti-AIF-1/Iba1 | Novus | Cat# NB100–1028 RRID: AB_521594 |
| Mouse monoclonal anti-Glial Fibrillary Acidic Protein (GFAP) | Sigma-Aldrich | Cat# G3893 RRID: AB_477010 |
| Chicken anti-HSP60 | EnCor Biotechnology | Cat#CPCA-HSP60 RRID: AB_2572330 |
| Mouse monoclonal anti-Strep-TagII (C23.21) | Absolute Antibody | Ab02208–1.1 |
| Strep-TactinXT-HRP | IBA Lifesciences | custom |
| Goat anti-rabbit IgG (H + L) DyLight800 | Cell Signaling Technology | Cat# 5151; RRID: AB_10697505 |
| Goat anti-mouse IgG IRDye 680RD | LI-COR Biosciences | Cat#925–68070 RRID:AB_2651128 |
| Donkey anti-goat IgG (H + L) Cross-Adsorbed Secondary Antibody, Alexa Fluor 568 | Thermo Fisher Scientific | Cat# A-11057 RRID: AB_2534104 |
| Donkey anti-chicken IgY (IgG) (H + L), Alexa Fluor 488 | Jackson ImmunoResearch Labs | Cat# 703–545−155; RRID: AB_2340375 |
| Donkey anti-mouse IgG (H + L) Antibody, Alexa Fluor 488 Conjugated | Thermo Fisher Scientific | Cat# A21202 RRID: AB_141607 |
| Donkey anti-Rabbit Cy5-AffiniPure | Jackson ImmunoResearch Labs | Cat# 711–175-152 RRID: AB_2340607 |
| Goat anti-Rabbit HRP | Cell Signaling Technology | Cat#7074P2; RRID: AB_2099233 |
| Donkey anti-Goat IgG (H + L) Highly Cross-Adsorbed Secondary Antibody, Alexa Fluor Plus 800 | Thermo Fisher Scientific | Cat#A32930; RRID: AB_2762842 |
| Donkey anti-Rabbit IgG (H + L) Highly Cross-Adsorbed Secondary Antibody, Alexa Fluor Plus 680 | Thermo Fisher Scientific | Cat#A32802; RRID: AB_2762836 |
| Biotinylated horse anti-rabbit IgG (H + L) | Vector Laboratories | Cat#: BA-1100–1.5; RRID: AB_2336201 |
| Biotinylated horse anti-goat IgG (H + L) | Vector Laboratories | Cat#: BA-9500–1.5; RRID: AB_2336123 |
| Biotinylated rabbit anti-sheep immunoglobulin | Vector Laboratories | Cat#: BA-6000–1.5 RRID: AB_2336217 |
|
Bacterial and virus strains | ||
| Lentivirus pLJC5-Tmem192–3xHA | This paper | RRID:Addgene_102930 |
| Lentivirus pLV[Exp]-EGFP:T2A: Hygro-hPGK>{N-TAP PGRN} | VectorBuilder | Catalog #: LVS(VB190712–1034dkb)-C |
| Lentivirus pLV[Exp]-EGFP:T2A: Hygro-hPGK>{GRN2+linker} | VectorBuilder | Catalog #: LVS(VB190712–1032cbw)-C |
| Lentivirus pLV[Exp]-EGFP:T2A: Hygro-hPGK>{GRN4+linker} | VectorBuilder | Catalog #: LVS(VB190712–1030aad)-C |
| rAAV1 strep-GFP | This Paper | Addgene; cat # in progress |
| rAAV1 hPGRN | This Paper | Addgene; cat # in progress |
| rAAV1 hGRN4 | This Paper | Addgene; cat # in progress |
| rAAV1 hGRN2 | This Paper | Addgene; cat # in progress |
|
Chemicals, peptides, and recombinant proteins | ||
| DAPI Nucleic Acid Stain | Thermo Fisher Scientific | Cat# 62248; CAS: 28718–90-3 |
| Pink Rino Tubes | Next Advance | Cat# PINKR1-RNA |
| Bullet Block | Nacalai | Cat# 13779–01 |
| HALT Protease and phosphatase inhibitor | Thermo Fisher Scientific | Cat# UK286007 |
| Diaminobenzidine (DAB) | TCI-Chemicals | Cat# D0077 |
| Pertex Mounting medium | CellPath | Cat# SEA-0100–00A |
| Epredia Immu-Mount | Fisher Scientific | Cat# 9990402 |
| SuperSignal West Femto Maximum Sensitivity Substrate |
Thermo Fisher Scientific | Cat# 34095 |
| Opti-MeM Reduced Serum Media | Gibco | Cat# 31985070 |
| DMEM high glucose, pyruvate | Gibco | Cat# 11995073 |
| Benzonase® | Sigma | Cat# E8263–25KU |
| HiTrap Q HP column | Amersham Biosciences | Cat# 17115401 |
| Lysyl endopeptidase | WAKO | Cat# 125–05061 |
| Trypsin | Pierce | Cat# 90059 |
| Sep-Pak C18 column | Waters | Cat# WAT036945 |
| 18-plex Tandem Mass Tag (TMTPro) kit | Thermo Fisher Scientific | Cat# A44520 and A52046 |
| 60mg HLB column | Waters | Cat# WAT094226 |
| BEH column | Waters | Cat# 186002353 |
| ReproSil-Pur: 120 C18-AQ 1.9um | Dr. Maisch HPLC GmbH | Cat# r119.aq.0001 |
| ACQUITY Premier BEH C18 Column, 1.7 μm, 2.1 × 100 mm |
Waters | Cat# 186009453 |
| ACQUITY Premier BEH Amide Column, 1.7 μm, 2.1 mm × 150 mm |
Waters | Cat#186009506 |
| HALO HILIC 2.0 μm, 3.0 × 150 mm column | Advanced Materials Technology | Cat#PN 91813–701 |
| REVERT total Protein Stain | LI-COR | Cat#926–11010 |
| Fish Serum Blocking Buffer | Thermo Fisher Scientific | Cat#37527 |
| Lysing Matrix D tubes | MP Biomedicals | Cat#116913050 |
| MES Running Buffer | Genscript | Cat#M00677 |
| ZymoPURE II Plasmid Maxiprep kit | Zymo Research | Cat#Z5139 |
| TransIT-LT1 Transfection reagent | Mirus Bio | Cat#MIR 2300 |
| Denarase | c-LEcta | Cat#VWR-20804–100K |
| Anti-HA magnetic beads | Thermo Fisher Scientific | Cat#88836 |
|
Critical commercial assays | ||
| Mouse on Mouse ImmPress HRP Polymer kit | Vector Laboratories | Cat#MP-2400 |
| Avidin-biotin-peroxidase complex (ABC) | Vector Laboratories | Cat#PK-6100 |
| Mouse GPNMB ELISA | R and D Systems | Cat#DY2330 |
| Human PGRN ELISA | R and D Systems | Cat#DY2420 |
|
Deposited data | ||
| Mouse brain proteomic dataset | This paper; https://www.ebi.ac.uk/pride | PXD041095 |
| Mouse brain metabolomics and lipidomics dataset | This paper; https://dataverse.unc.edu/dataverse/Emory | https://doi.org/10.15139/S3/7Z2SVL |
|
Experimental models: Cell lines | ||
| HeLa Grn+/+ | Nguyen et al.84 | N/A |
| HeLa Grn−/− | Nguyen et al.84 | N/A |
| MEF Grn−/− | Nguyen et al.84 | N/A |
| MEF Grn+/+ | Nguyen et al.84 | N/A |
| HEK293T | ATCC | Cat# CRL-3216; RRID:CVCL_0063 |
|
Experimental models: Organisms/strains | ||
| Top10 E coli | Invitrogen | Cat#C404010 |
| B6(Cg)-Grntm1.1Aidi | Jackson Labs | IMSR Cat# JAX:013175; RRID: IMSR_JAX:013175 |
|
Recombinant DNA | ||
| pLV[Exp]-EGFP:T2A:Hygro-hPGK>{N-TAP PGRN} | VectorBuilder | Catalog #: Ecoli(VB190712–1034dkb) |
| pLV[Exp]-EGFP:T2A:Hygro-hPGK>{GRN2+linker} | VectorBuilder | Catalog #: Ecoli(VB190712–1032cbw) |
| pLV[Exp]-EGFP:T2A:Hygro-hPGK>{GRN4+linker} | VectorBuilder | Catalog #: Ecoli(VB190712–1030aad) |
| pLJC5-Tmem192–3xHA | Addgene | RRID: Addgene_102930 |
| pCMV-VSV-G | Addgene | RRID: Addgene_8454 |
| pCMV-dR8.2 dvpr | Addgene | RRID: Addgene_8455 |
| pAAV strep-GFP | This Paper | Addgene; cat # in progress |
| pAAV hPGRN | This Paper | Addgene; cat # in progress |
| pAAV hGRN4 | This Paper | Addgene; cat # in progress |
| pAAV hGRN2 | This Paper | Addgene; cat # in progress |
|
Software and algorithms | ||
| Proteome Discoverer Suite (v.2.4.1.15) | Thermo Fisher Scientific | RRID:SCR_014477 |
| Prism 9 | Graphpad Software |
https://www.graphpad.com/scientificsoftware/prism/; RRID:SCR_002798 |
| IMARIS 10.0.1 | Oxford Instruments | https://imaris.oxinst.com/support/imarisrelease-notes/10-0-0; RRID:SCR_007370 |
| BioRender | https://www.biorender.com | RRID:SCR_018361 |
| PCAtools R package | Blighe et al.84 | https://github.com/kevinblighe/PCAtools |
| Metascape | Zhou et al.85 | https://metascape.org; RRID:SCR_016620 |
| Quickomics | Gao et al.86 | https://quickomics.bxgenomics.com/ |
| Ggmsa R package | Zhou et al.87 | https://github.com/YuLab-SMU/ggmsa |
| Bio3D R package | Grant et al.88 |
http://thegrantlab.org/bio3d/; RRID:SCR_024266 |
| CellProfiler | Lamprecht et al.89 | www.cellprofiler.org;RRID:SCR_007358 |
| Msa R | Bodenhofer et al.90 | https://github.com/UBod/msa |
| Ggplot2 | Wickham91 |
https://ggplot2.tidyverse.org; RRID:SCR_014601 |
| SCIEX OS 3.1 | Sciex | https://sciex.com/br/products/software/sciex-os-software |
| Microsoft R Open v3.4.2 | Microsoft | https://mran.microsoft.com |
| LI-COR Image Studio | LI-COR | RRID:SCR_015795 |
| Adobe Illustrator | Adobe | RRID:SCR_010279 |
| Adobe Photoshop | Adobe | RRID:SCR_014199 |