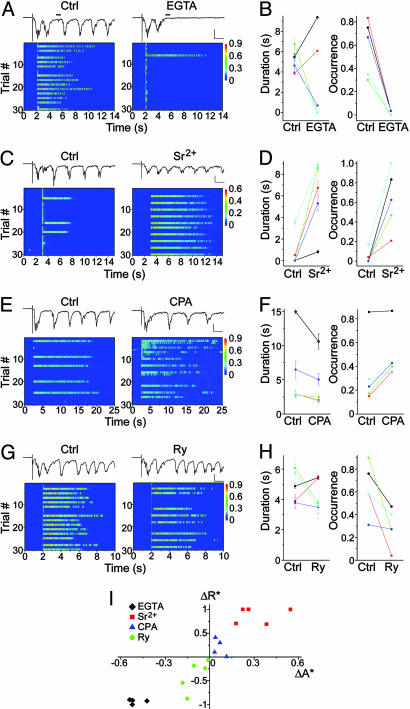
Fig. 4.
The role of asynchronous synaptic transmission and its modulation in network reverberation. (A) Suppression of reverberation by EGTA-AM (100 μM). Note that, in the sample traces, the asynchronous portion of PSC (measured by the mean current amplitude over the 50-ms period marked by the black bar) decreased dramatically (from 126 pA in control to 27 pA in EGTA-AM). (B) Summary of effects of EGTA-AM on reverberation duration (from 5.21 ± 0.48 s to 3.23 ± 1.09 s, n = 5, P = 0.4) and occurrence (from 0.58 ± 0.11 to 0.02 ± 0.01, P < 0.01). (C) Enhancement of reverberation by replacing half of the extracellular Ca2+ with Sr2+ (from 3 mM Ca2+ to 1.5 mM Ca2+ plus 1.5 mM Sr2+). (D) Summary of effects of Sr2+ on reverberation duration (from 0.81 ± 0.69 s to 6.06 ± 1.46 s, n = 5, P < 0.02) and occurrence (from 0.04 ± 0.03 to 0.63 ± 0.14, P < 0.01). (E) Enhancement of reverberation by CPA (50 μM). (F) Summary of effects of CPA on reverberation duration (from 5.66 ± 1.94 s to 4.26 ± 1.36 s, n = 6, P = 0.07) and occurrence (from 0.34 ± 0.13 to 0.48 ± 0.10, P < 0.05). (G) Suppression of reverberation by ryanodine (20 μM). (H) Summary of effects of ryanodine on reverberation duration (from 4.87 ± 0.46 s to 4.33 ± 0.45 s, n = 5, P = 0.51) and occurrence (from 0.63 ± 0.10 to 0.29 ± 0.07, P < 0.05). (I) Correlation between normalized changes in the occurrence of reverberation (R) and asynchronous release (A) caused by different pharmacological challenges (see Materials and Methods for definitions of ΔR* and ΔA*. Correlation coefficient ρ = 0.93, P < 0.001). (Scale in A, C, E, and G, 100 ms, 0.5 nA.)

