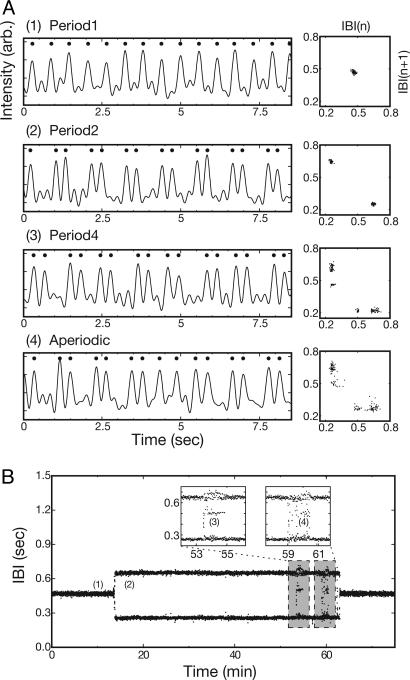
Fig. 1.
Complex-periodic local oscillations in in vitro cardiac tissue. (A) Time series of intensity variation caused by the local mechanical contractile motion of the cardiac cell tissue and the corresponding return maps of IBIs exhibiting P-1 (1), P-2 (2), P-4 (3), and aperiodic (4) oscillations. (B) Time series of IBIs exhibiting various oscillatory states and their spontaneous transitions. The time series is acquired at the point marked by a white cross in Fig. 3A. In A, dots mark the peaks in the time series, i.e., activations. The return maps of IBIs are constructed based on time series data taken over 1-min durations each. B Insets show the P-4 and aperiodic states in more detail. This observation is made with a 12-days in vitro sample.

