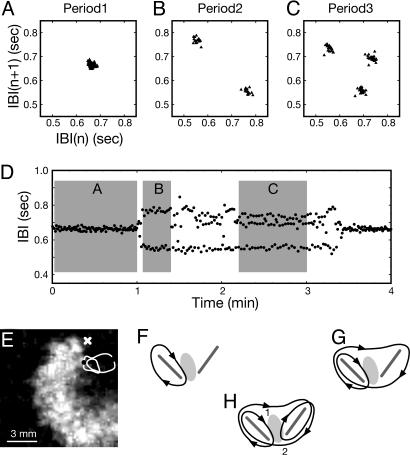
Fig. 2.
Complex-periodic meandering spiral wave around a pair of conduction blocks (see Movie 1). (A–C) Return maps of IBIs indicating P-1, P-2, and P-3 oscillation, respectively. (D) Time series of IBIs exhibiting P-1, P-2, and P-3 oscillatory states and spontaneous transitions among them. (E) Spatiotemporally enhanced grayscale image of a cardiac spiral wave. Black dot, current spiral tip location; white line, tip trajectory for two revolutions; white “x,” location at which the IBI data of A–D are taken. (F–H) Qualitative representation of the orbits (black lines with embedded arrowheads indicate the direction of tip motion) traced by the spiral tip corresponding to the P-1 (A), P-2 (B), and P-3 (C) oscillations. Pairs of gray line segments and oval-shaped gray areas in F–H schematically illustrate the linear (absolute) conduction blocks and the partial conduction block, respectively. Each return map of A–C is plotted based on parts of time series as marked with gray rectangles in D. The whole observation is made with a 5-days-in vitro sample.

