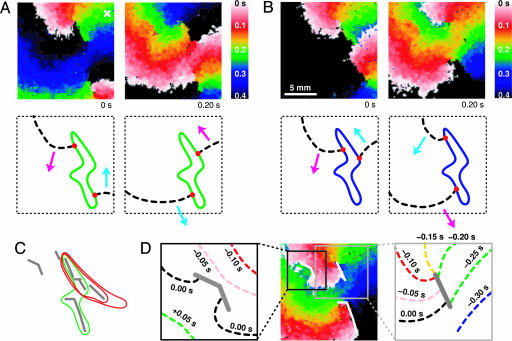
Fig. 3.
Activation time map images of a pair of co-rotating spiral waves and their tip orbits generating P-1 oscillation of Fig. 1 A1 in A and P-2 oscillation of Fig. 1 A2 in B (see Movie 2, which is published as supporting information on the PNAS web site). The activation time maps on the right of A and B are taken 0.20 s after those on the left. The diagrams below the activation time map images illustrate the pair of co-rotating wave fronts (dashed black lines) and the orbits traced by the tips [green in A and blue in B, with the tips themselves as red dots]. The tip orbit corresponding to the P-4 oscillation of Fig. 1 A4 is indicated with a red, double-looped orbit in C. C also includes the P-1 (and P-2) orbit in a green, single-looped orbit and the neighboring conduction blocks in gray line segments. The single activation time map of D indicates three different conduction blocks in white solid line segments. All image frames have the same dimension except for D Insets. D Insets show wave fronts at different times compared to the time of the activation time map of D. Activation times in the activation time map images are indicated with a continuous spectrum of colors where white, red, green, blue, and black indicate 0.0, 0.1, 0.2, 0.3, and 0.4 s or more, respectively.

