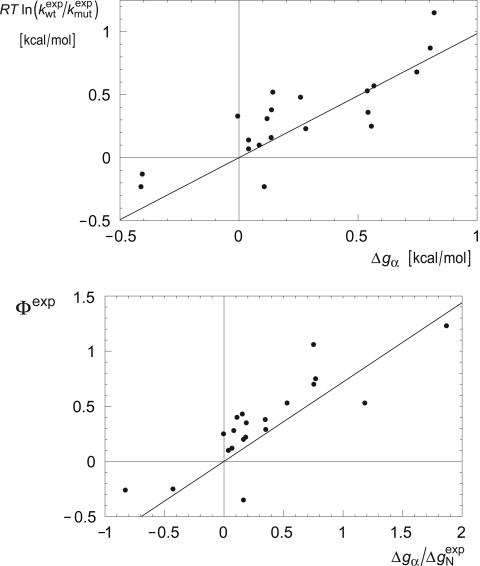
Fig. 3.
Correlation analysis for mutations in the CI2 helix. (Upper) ln( ) versus Δg = ln (
 ) estimated from helicities Pα predicted by agadir (see Table 1). The correlation coefficient r is 0.83, and the slope of the fitted line through the origin is 0.98. The slope of this line is an estimate for the parameter χα of Eq. 8. For subsets of the data generated by deleting up to two data points, the correlation coefficient r varies from 0.77 to 0.93, and the linear slope varies from 0.87 to 1.07. (Lower) Φexp versus
  . The correlation coefficient r is 0.85, and the slope of the fitted line through the origin is 0.71. For data subsets generated by deleting up to two data points, r varies from 0.79 to 0.90, and the slope varies from 0.64 to 0.90.

