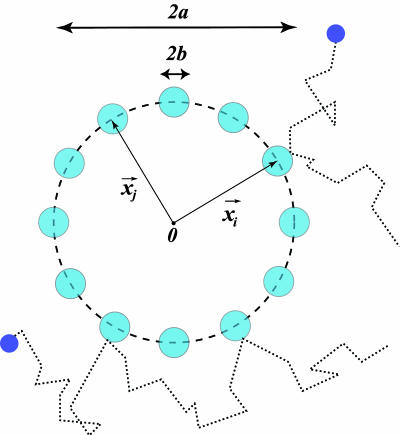
Fig. 3.
Schematic representation of a cluster of m receptors of size b, distributed uniformly on a ring of size a. For a ≫ b, the relative accuracy in measurement of the substrate concentration improves as 1/ until mb ∼ a, at which point the binding/unbinding events of nearby receptors are no longer independent.

