Fig. 3.
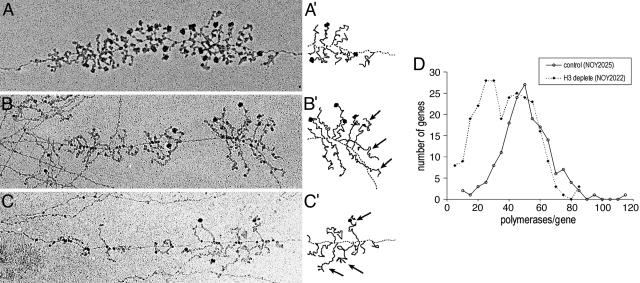
Representative electron micrographs of 35S rRNA genes from H3-depleted cells. (A) Control NOY2025 cells. A gene with ≈51 polymerases (close to the average polymerase density for this control strain) is shown. (B) H3-depleted NOY2022 cells. A gene with ≈34 polymerases (close to the average polymerase density for H3-depleted cells) is shown. (C) H3-depleted NOY2022 cells. A gene with 26 polymerases is shown. Schematic representations of the ends of the genes in A, B, and C are in A′, B′, and C′, respectively. Arrows indicate the longer uncleaved rRNA transcripts. (D) Decrease in polymerase density per gene in H3-depleted NOY2022 relative to control NOY2025 cells (at 4 h after the shift to glucose). The number of polymerases per gene was counted for 261 genes from H3-depleted cells and for 170 genes from control cells. Distribution of polymerases among transcribed genes is plotted by grouping with an increment of 5.

